Friends,
It is a phenomenal time to be a cash buyer and/or a luxury buyer. Additionally, we still have a seller's market the majority of our price bands. Details below!
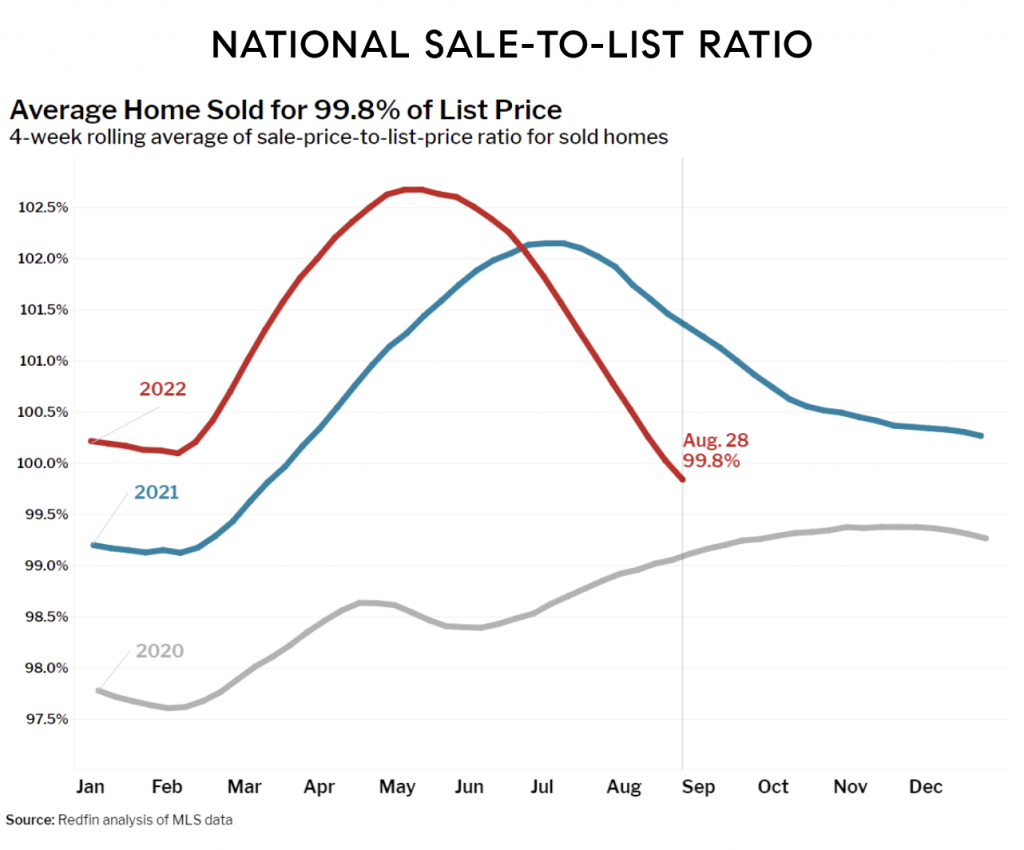
Nationally, rents are falling.
|
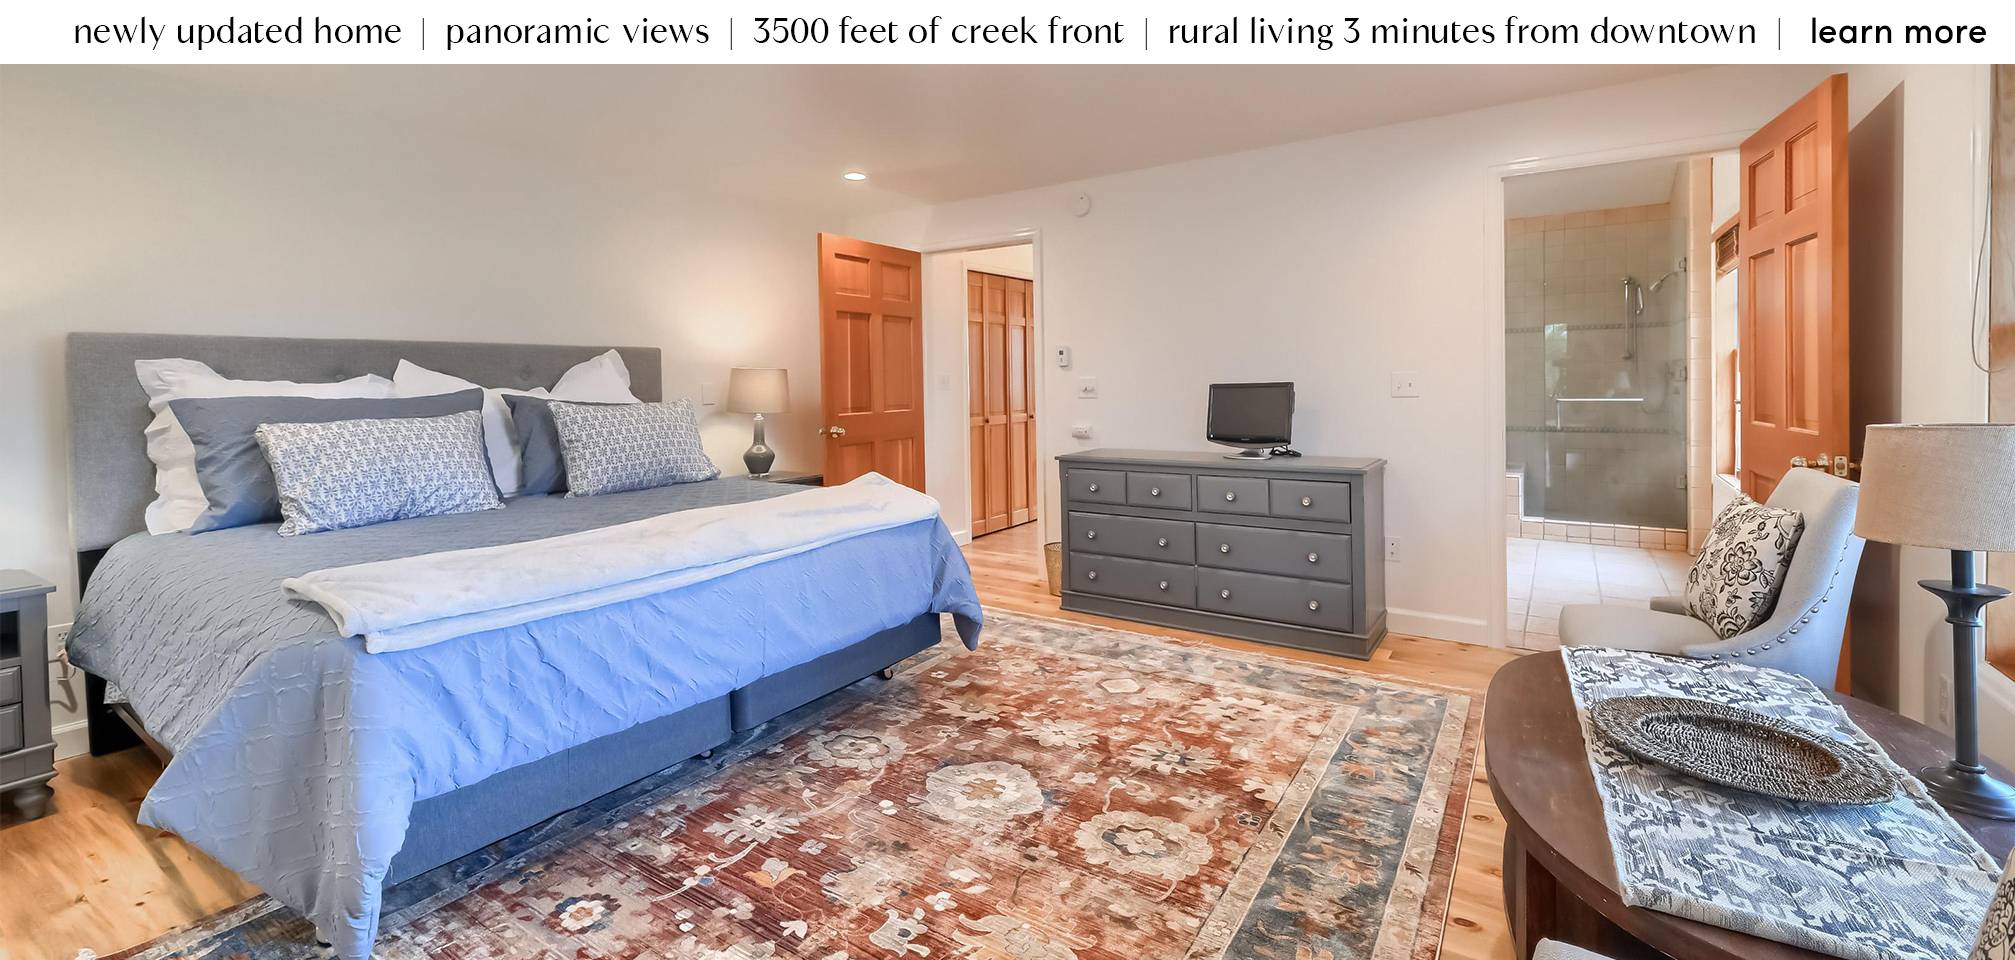
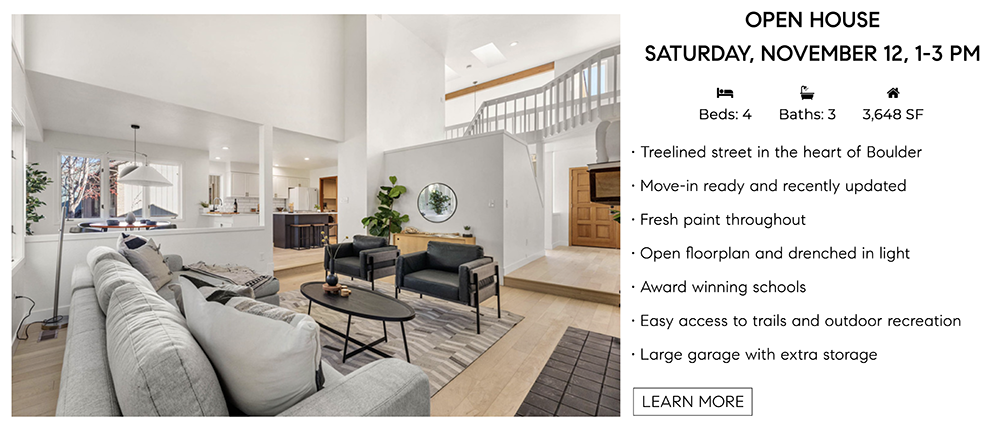
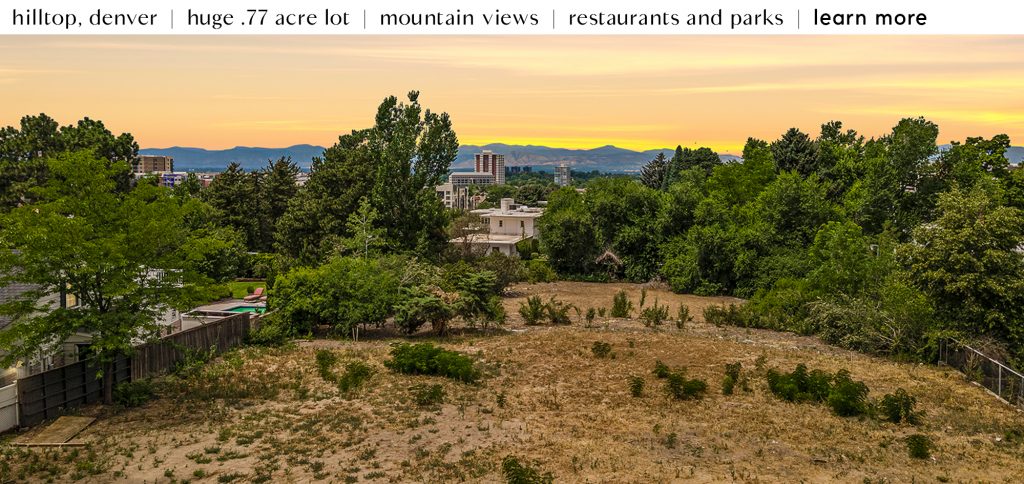
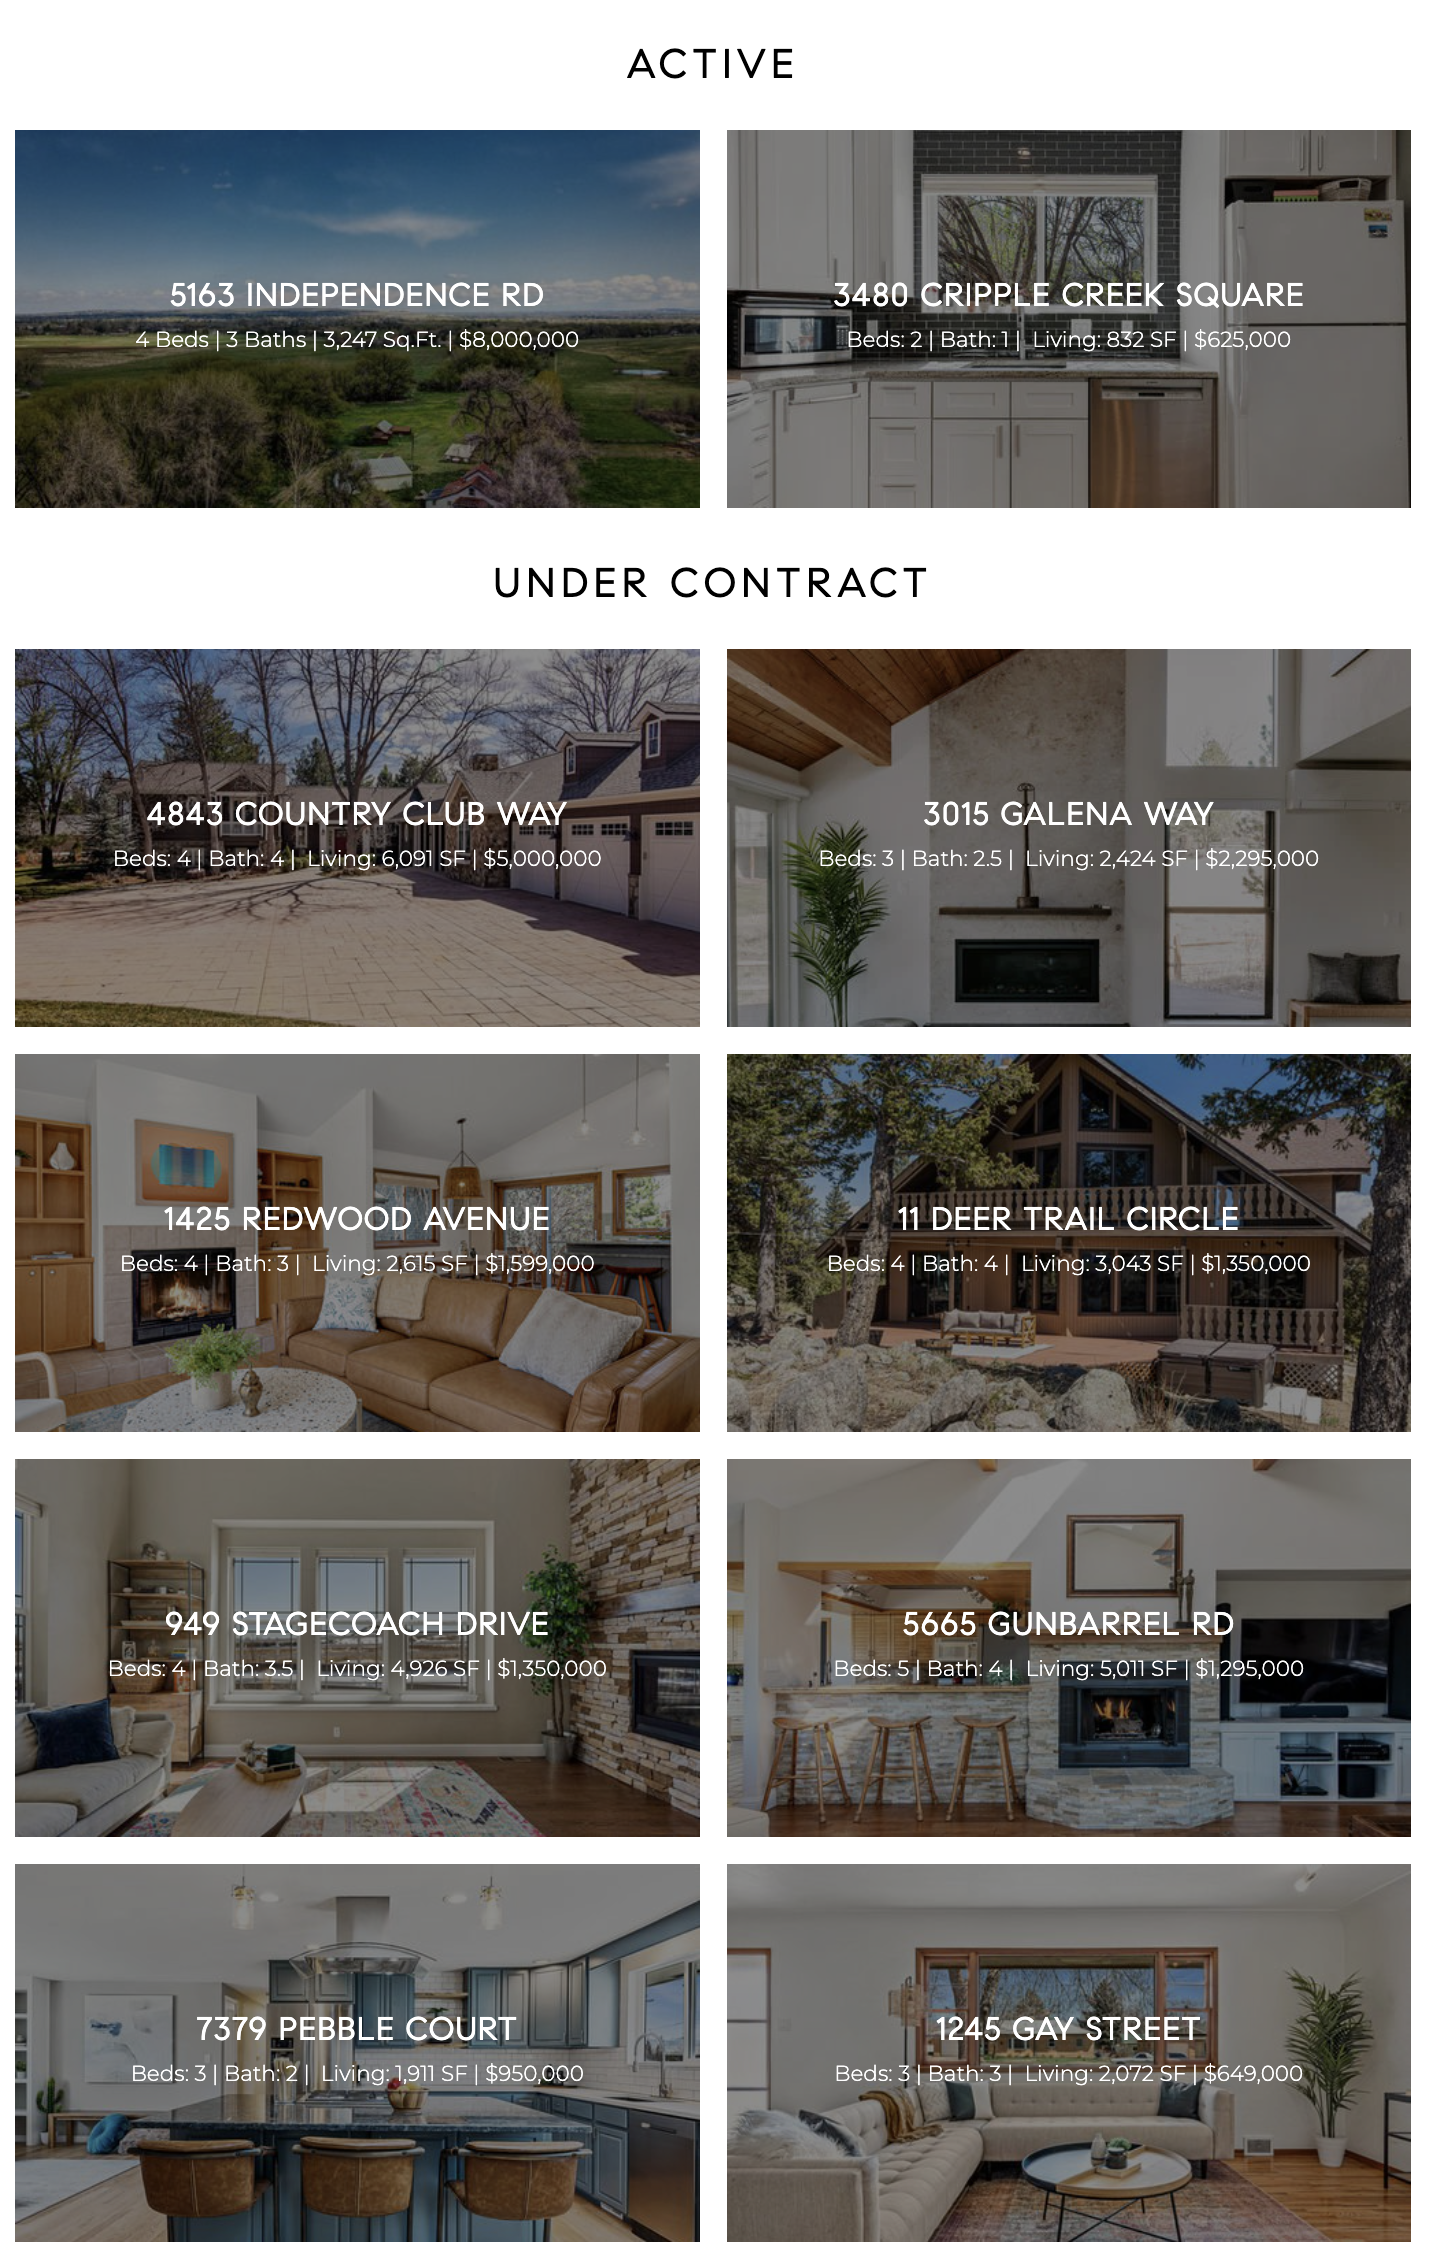
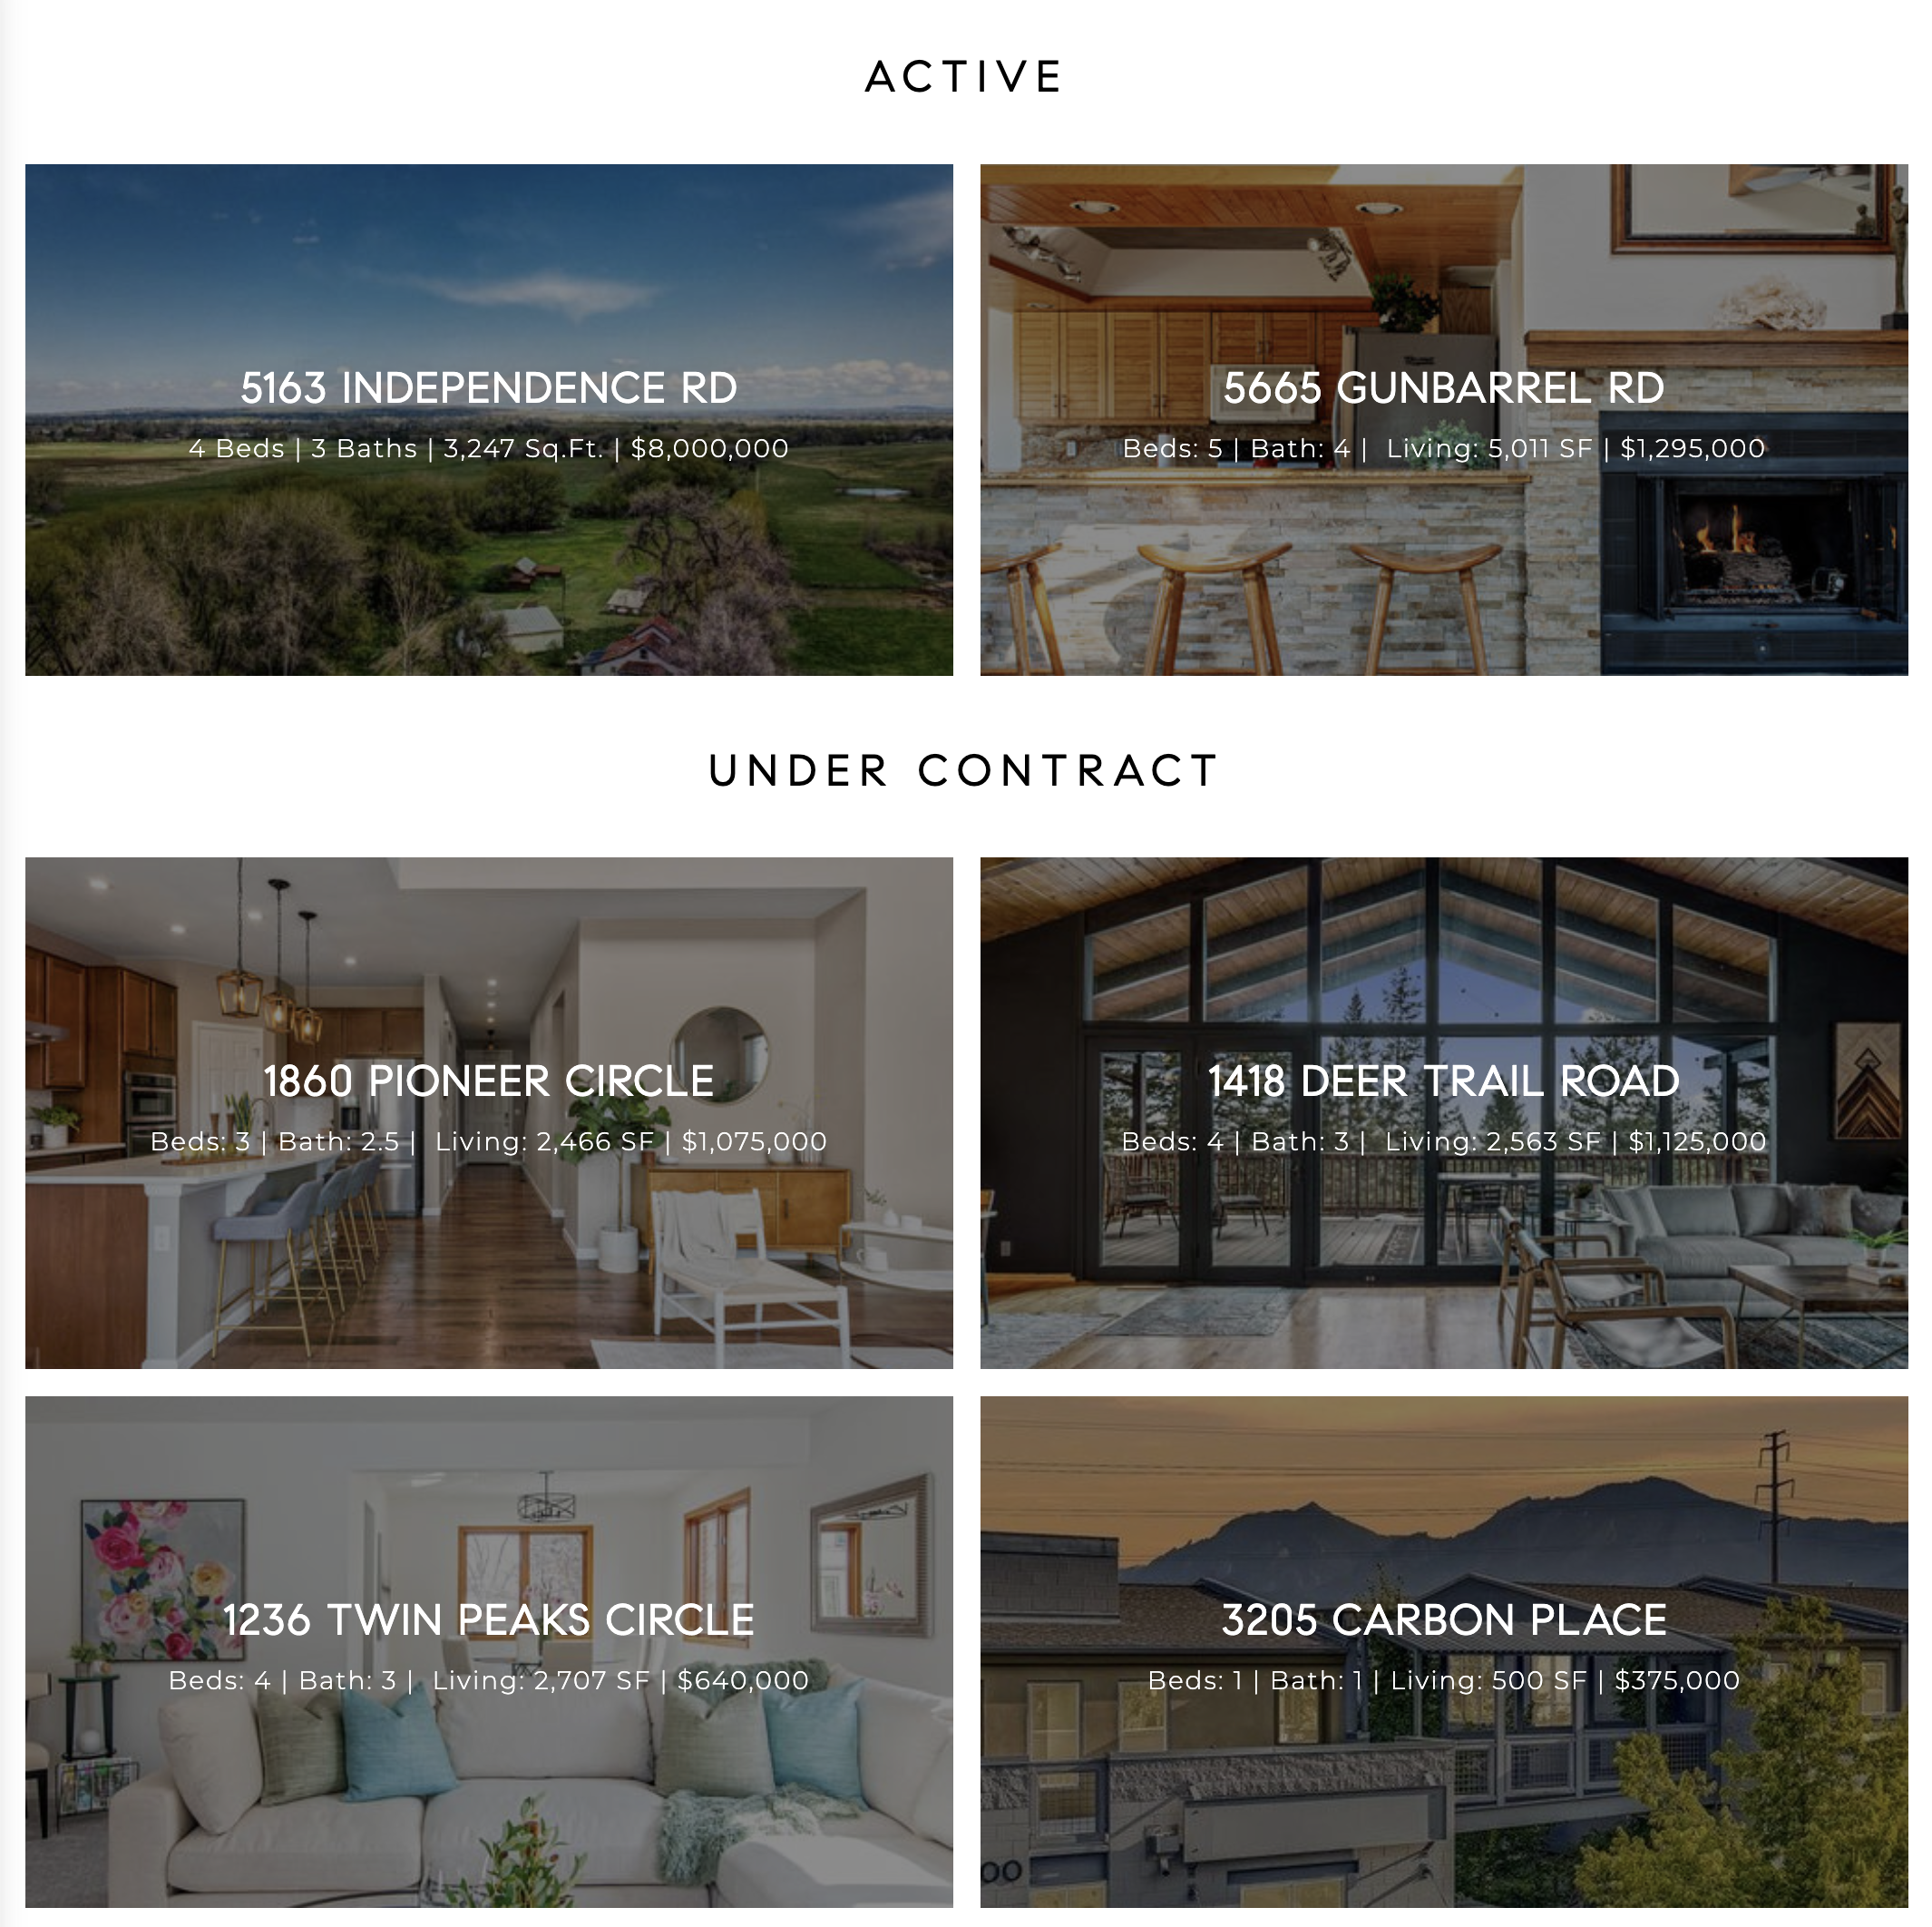
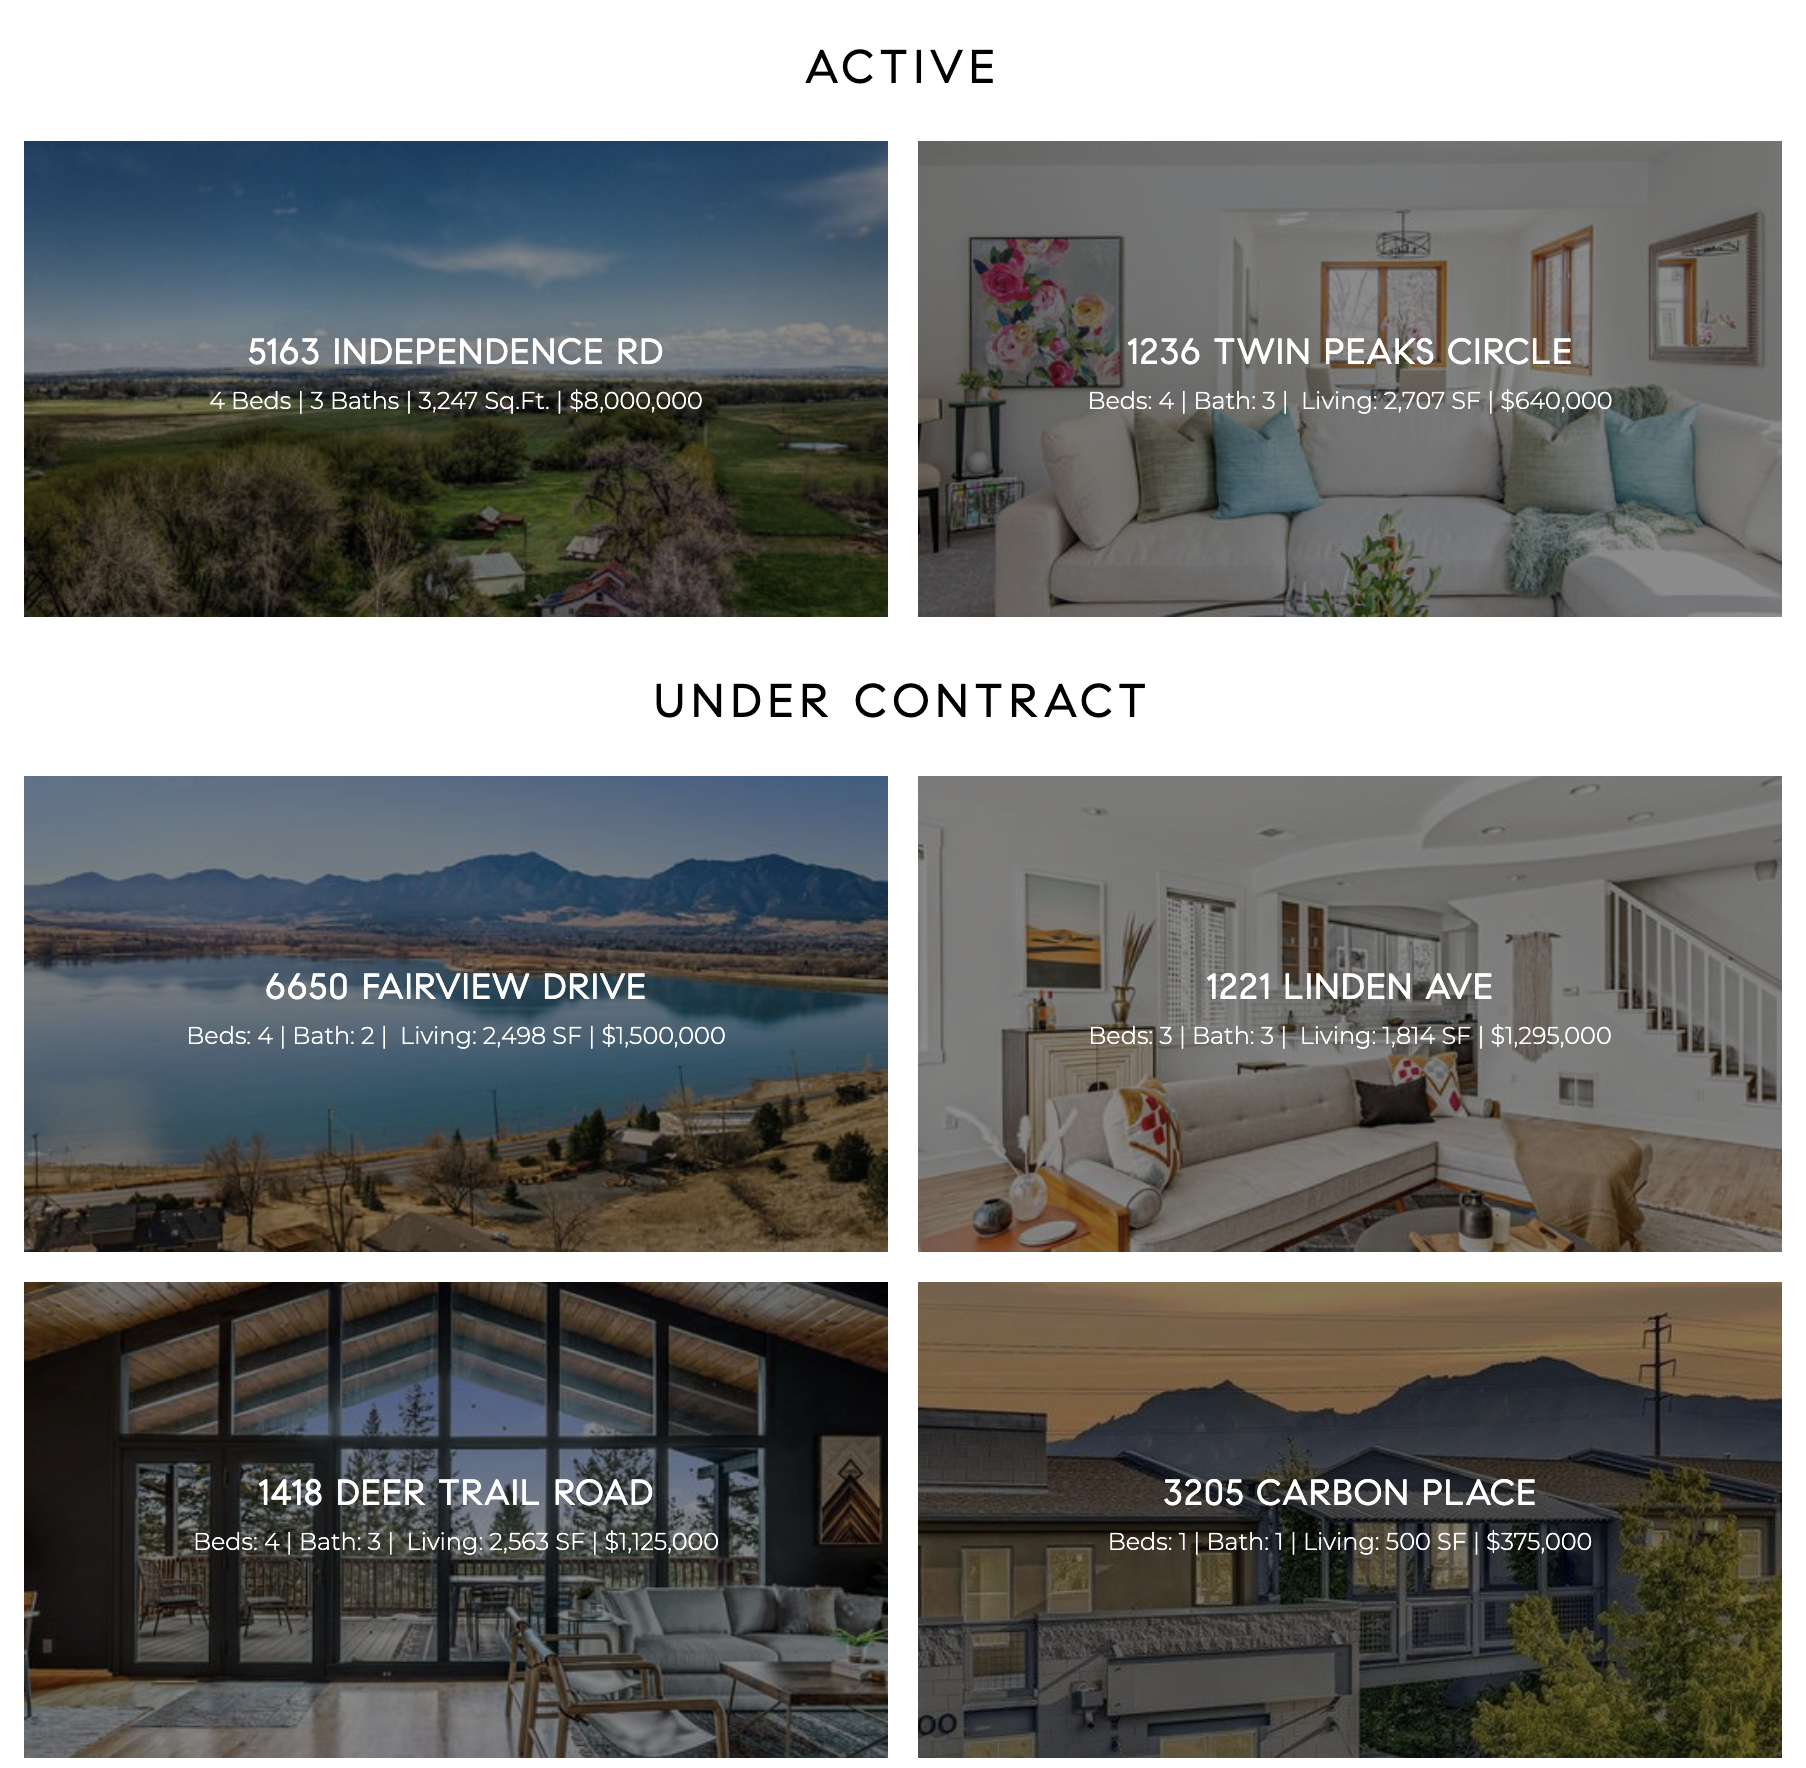
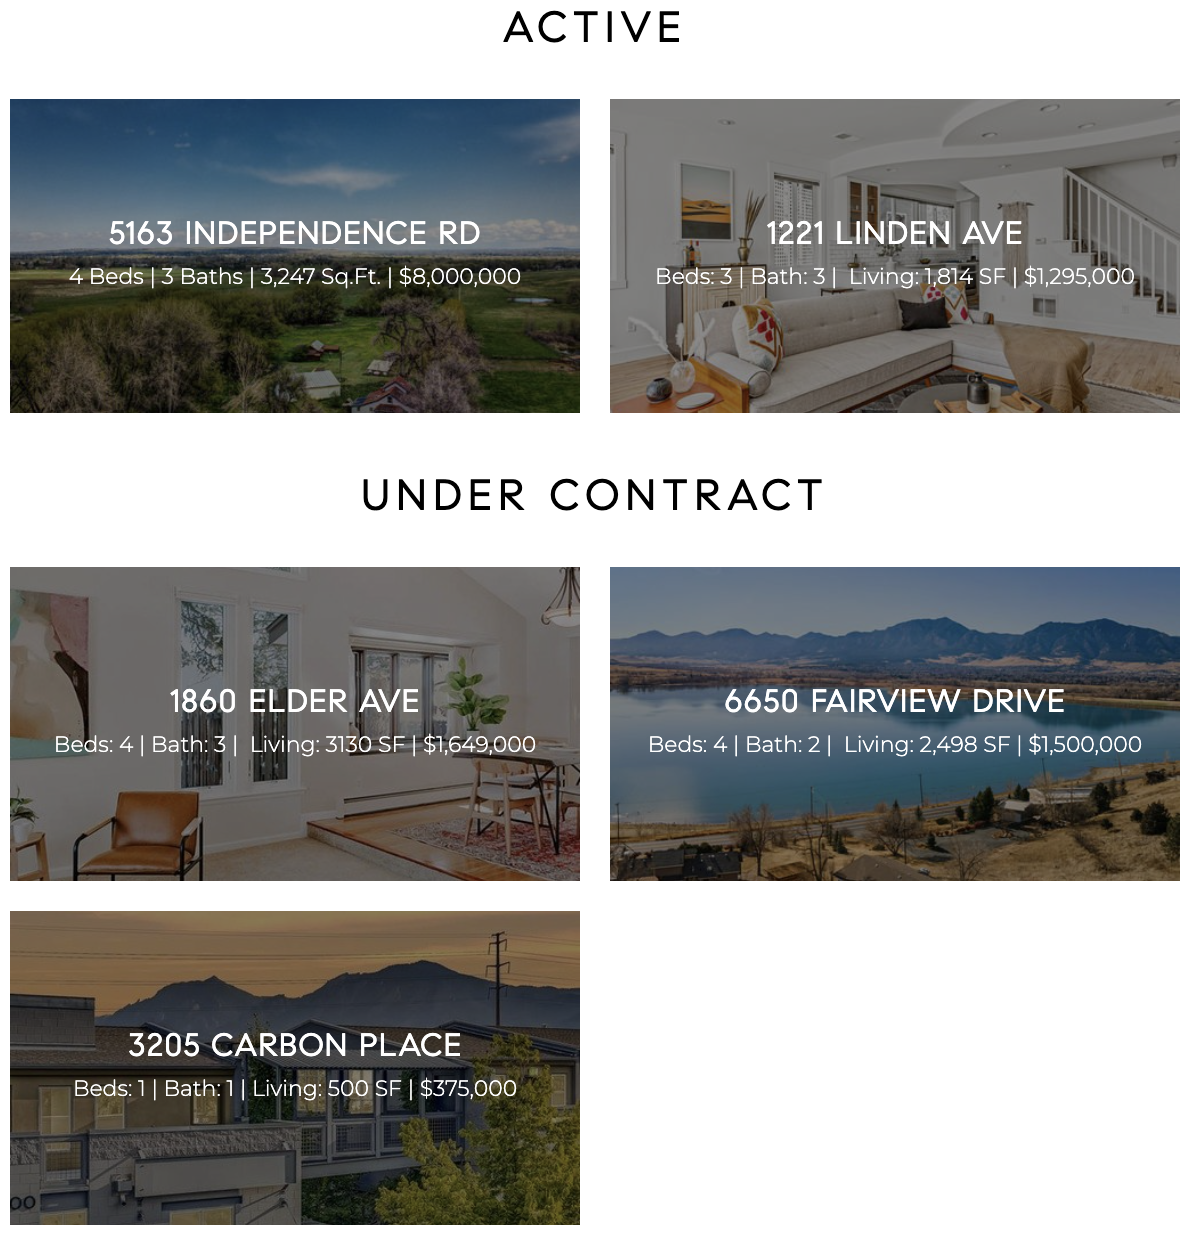
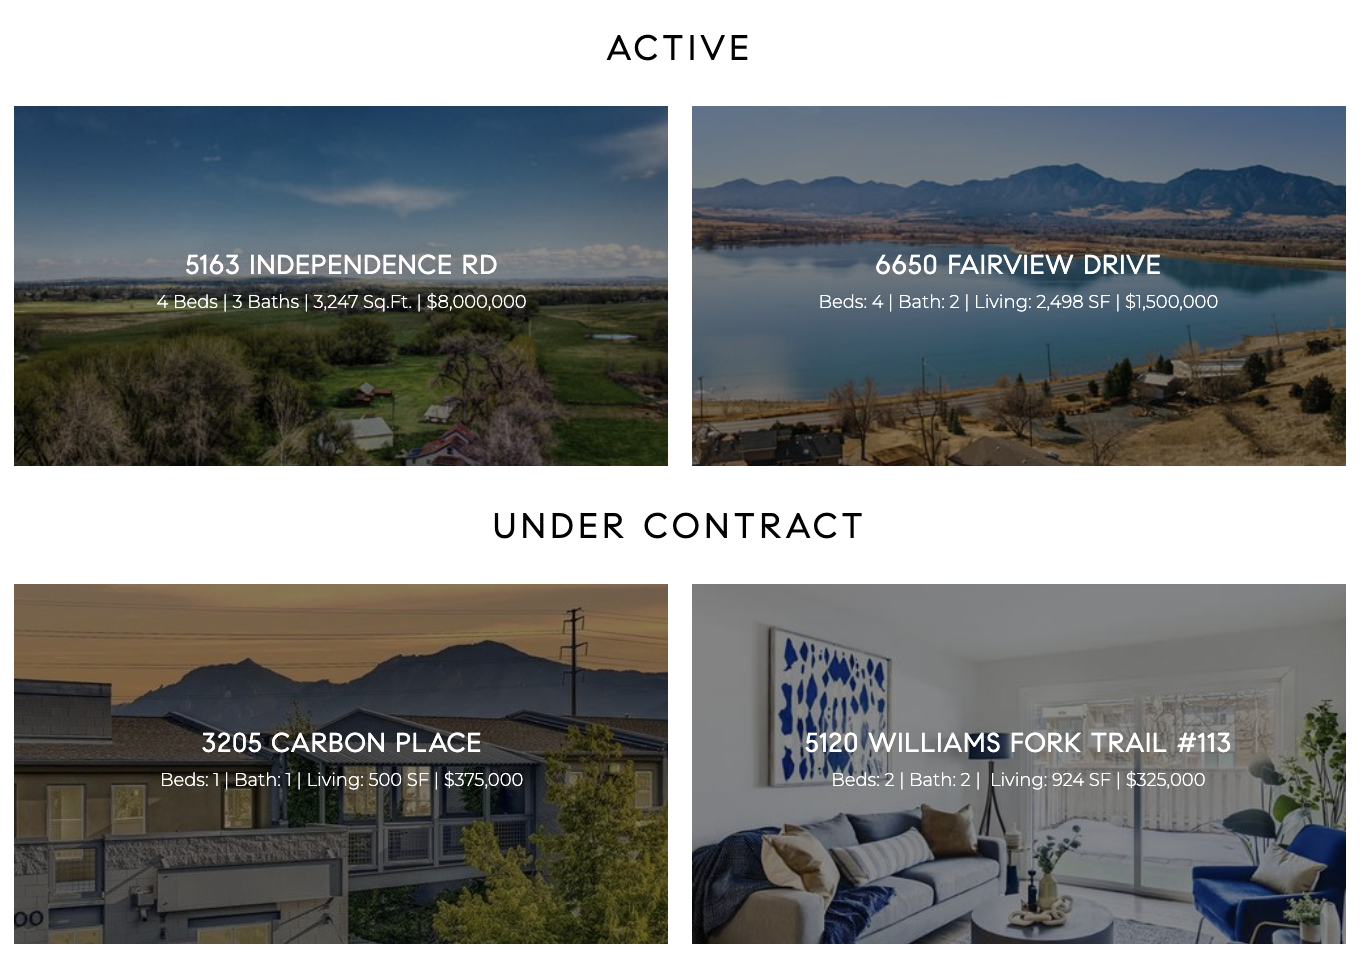
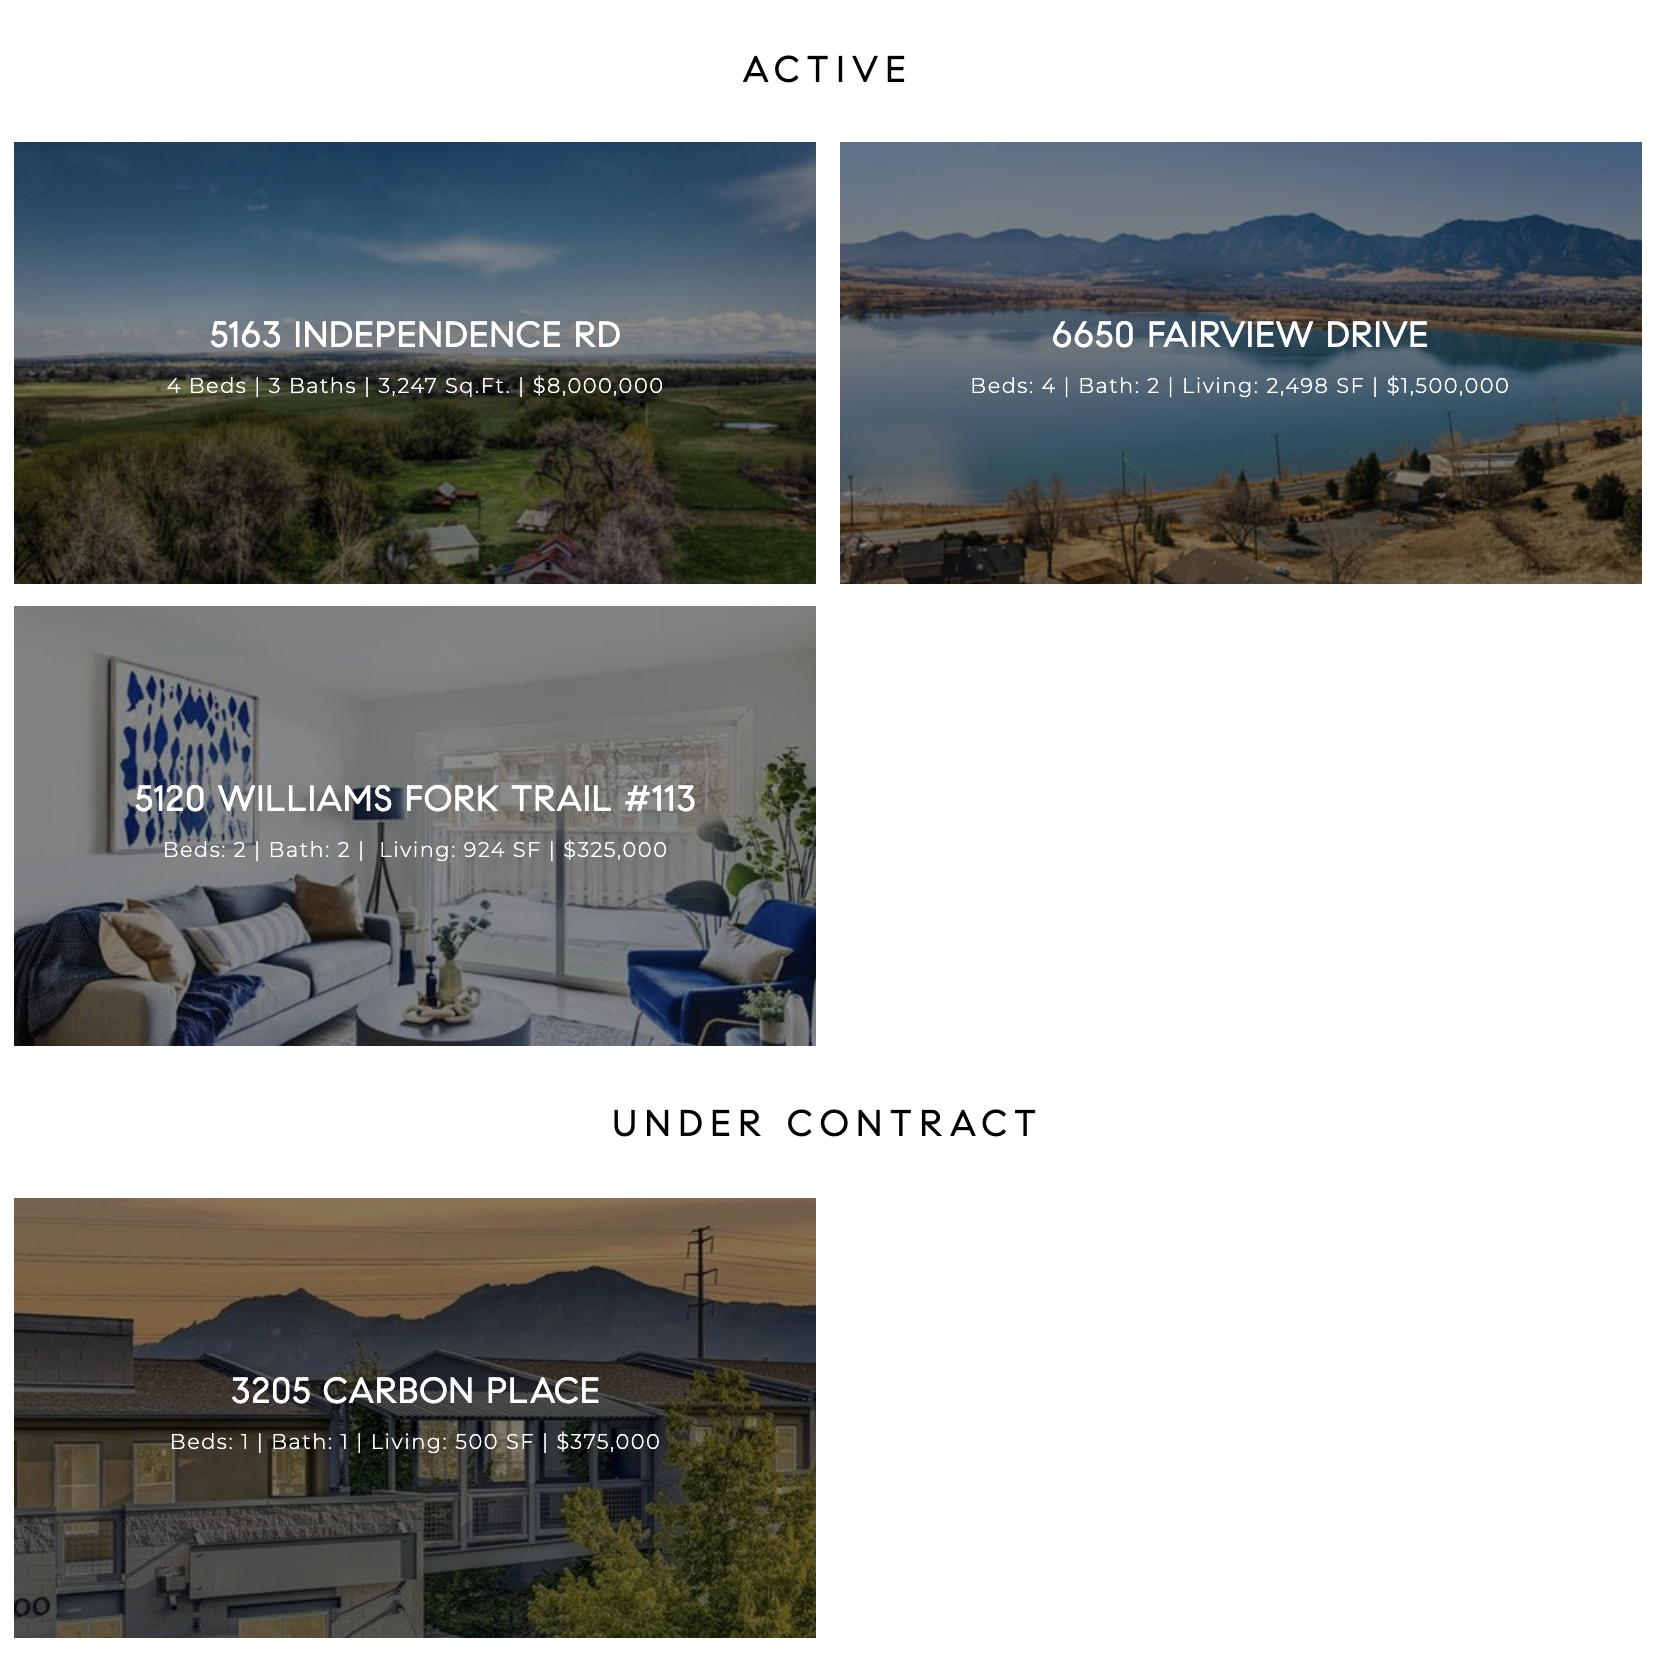
Click anywhere below to check out Burgess Group | Compass Boulder realtor team’s current exclusive listings.
|
In the City of Boulder, the lower-priced segments, up to $1.499mm, reflect solid to fairly strong seller's markets, and the $2-2.499mm range is also a strong seller's market.
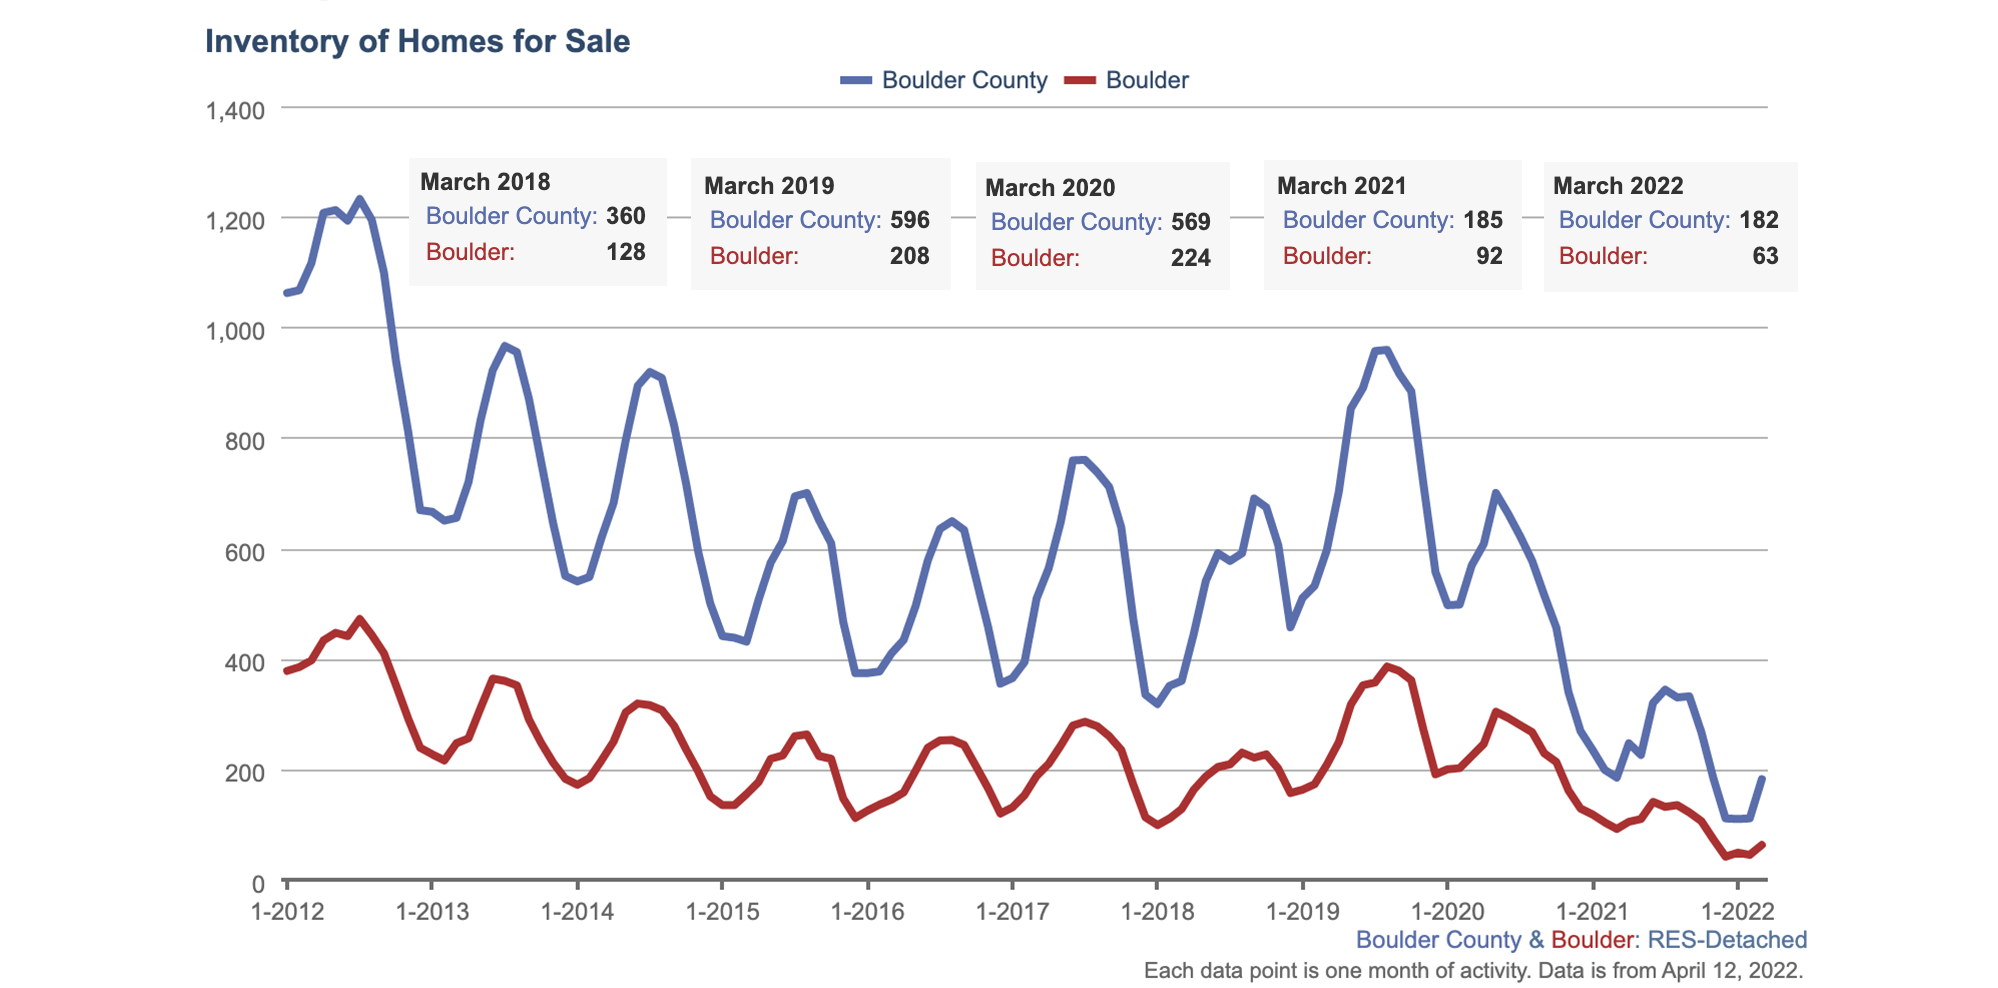
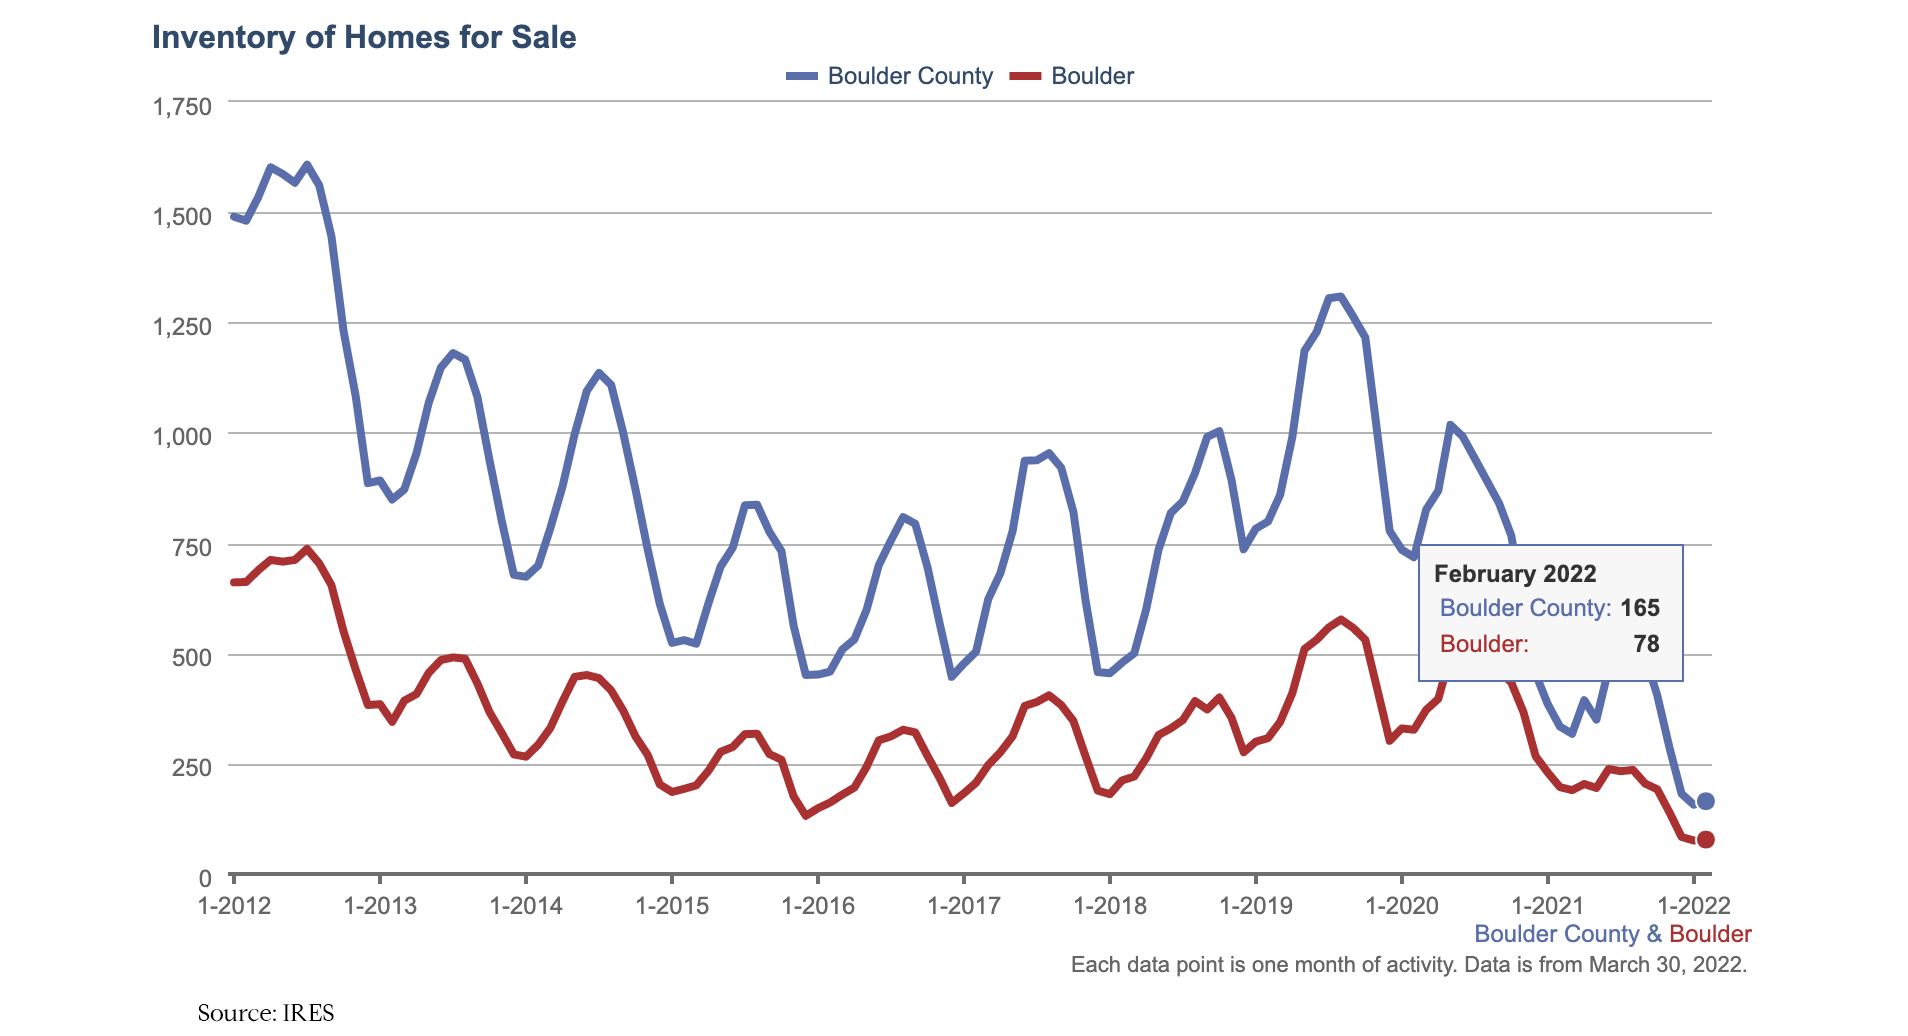
Most of our market has fairly low inventory. Inventory is projected to increase as interest rates maintain in the 8s, so if you’re considering selling, check the month’s supply of inventory noted below and give our Boulder realtor team a jingle to discuss the nuances of your property and goals.
The $2.5mm+ segment is an extreme buyer's market - a tremendous opportunity for cash luxury buyers or for those who can self-fund a loan or get a family loan.
|
Local Market Nitty Gritty - Boulder County
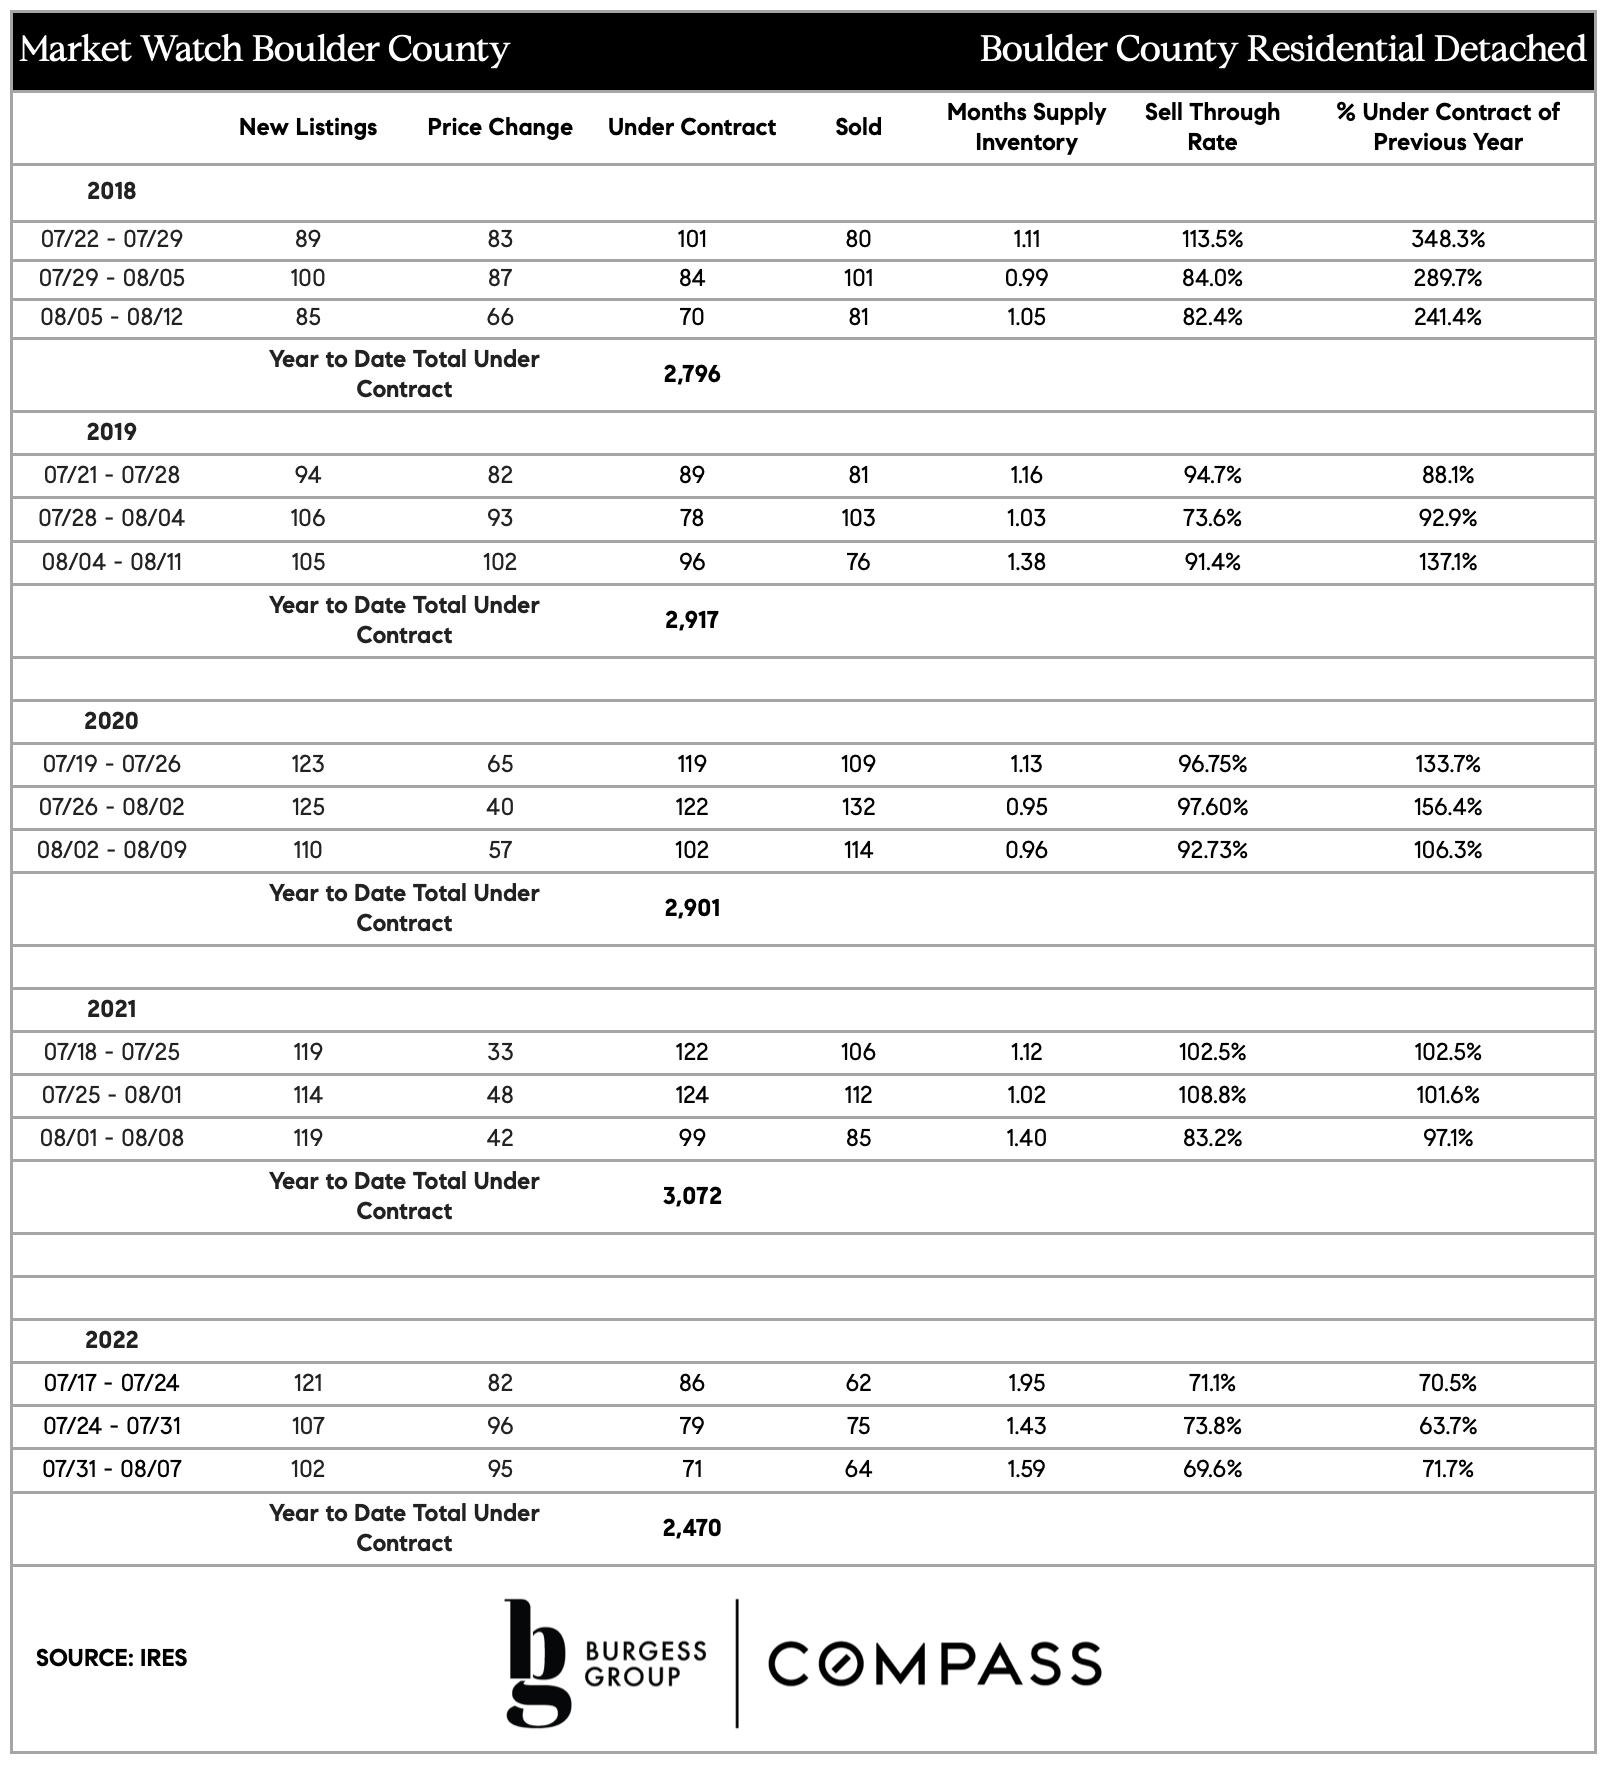
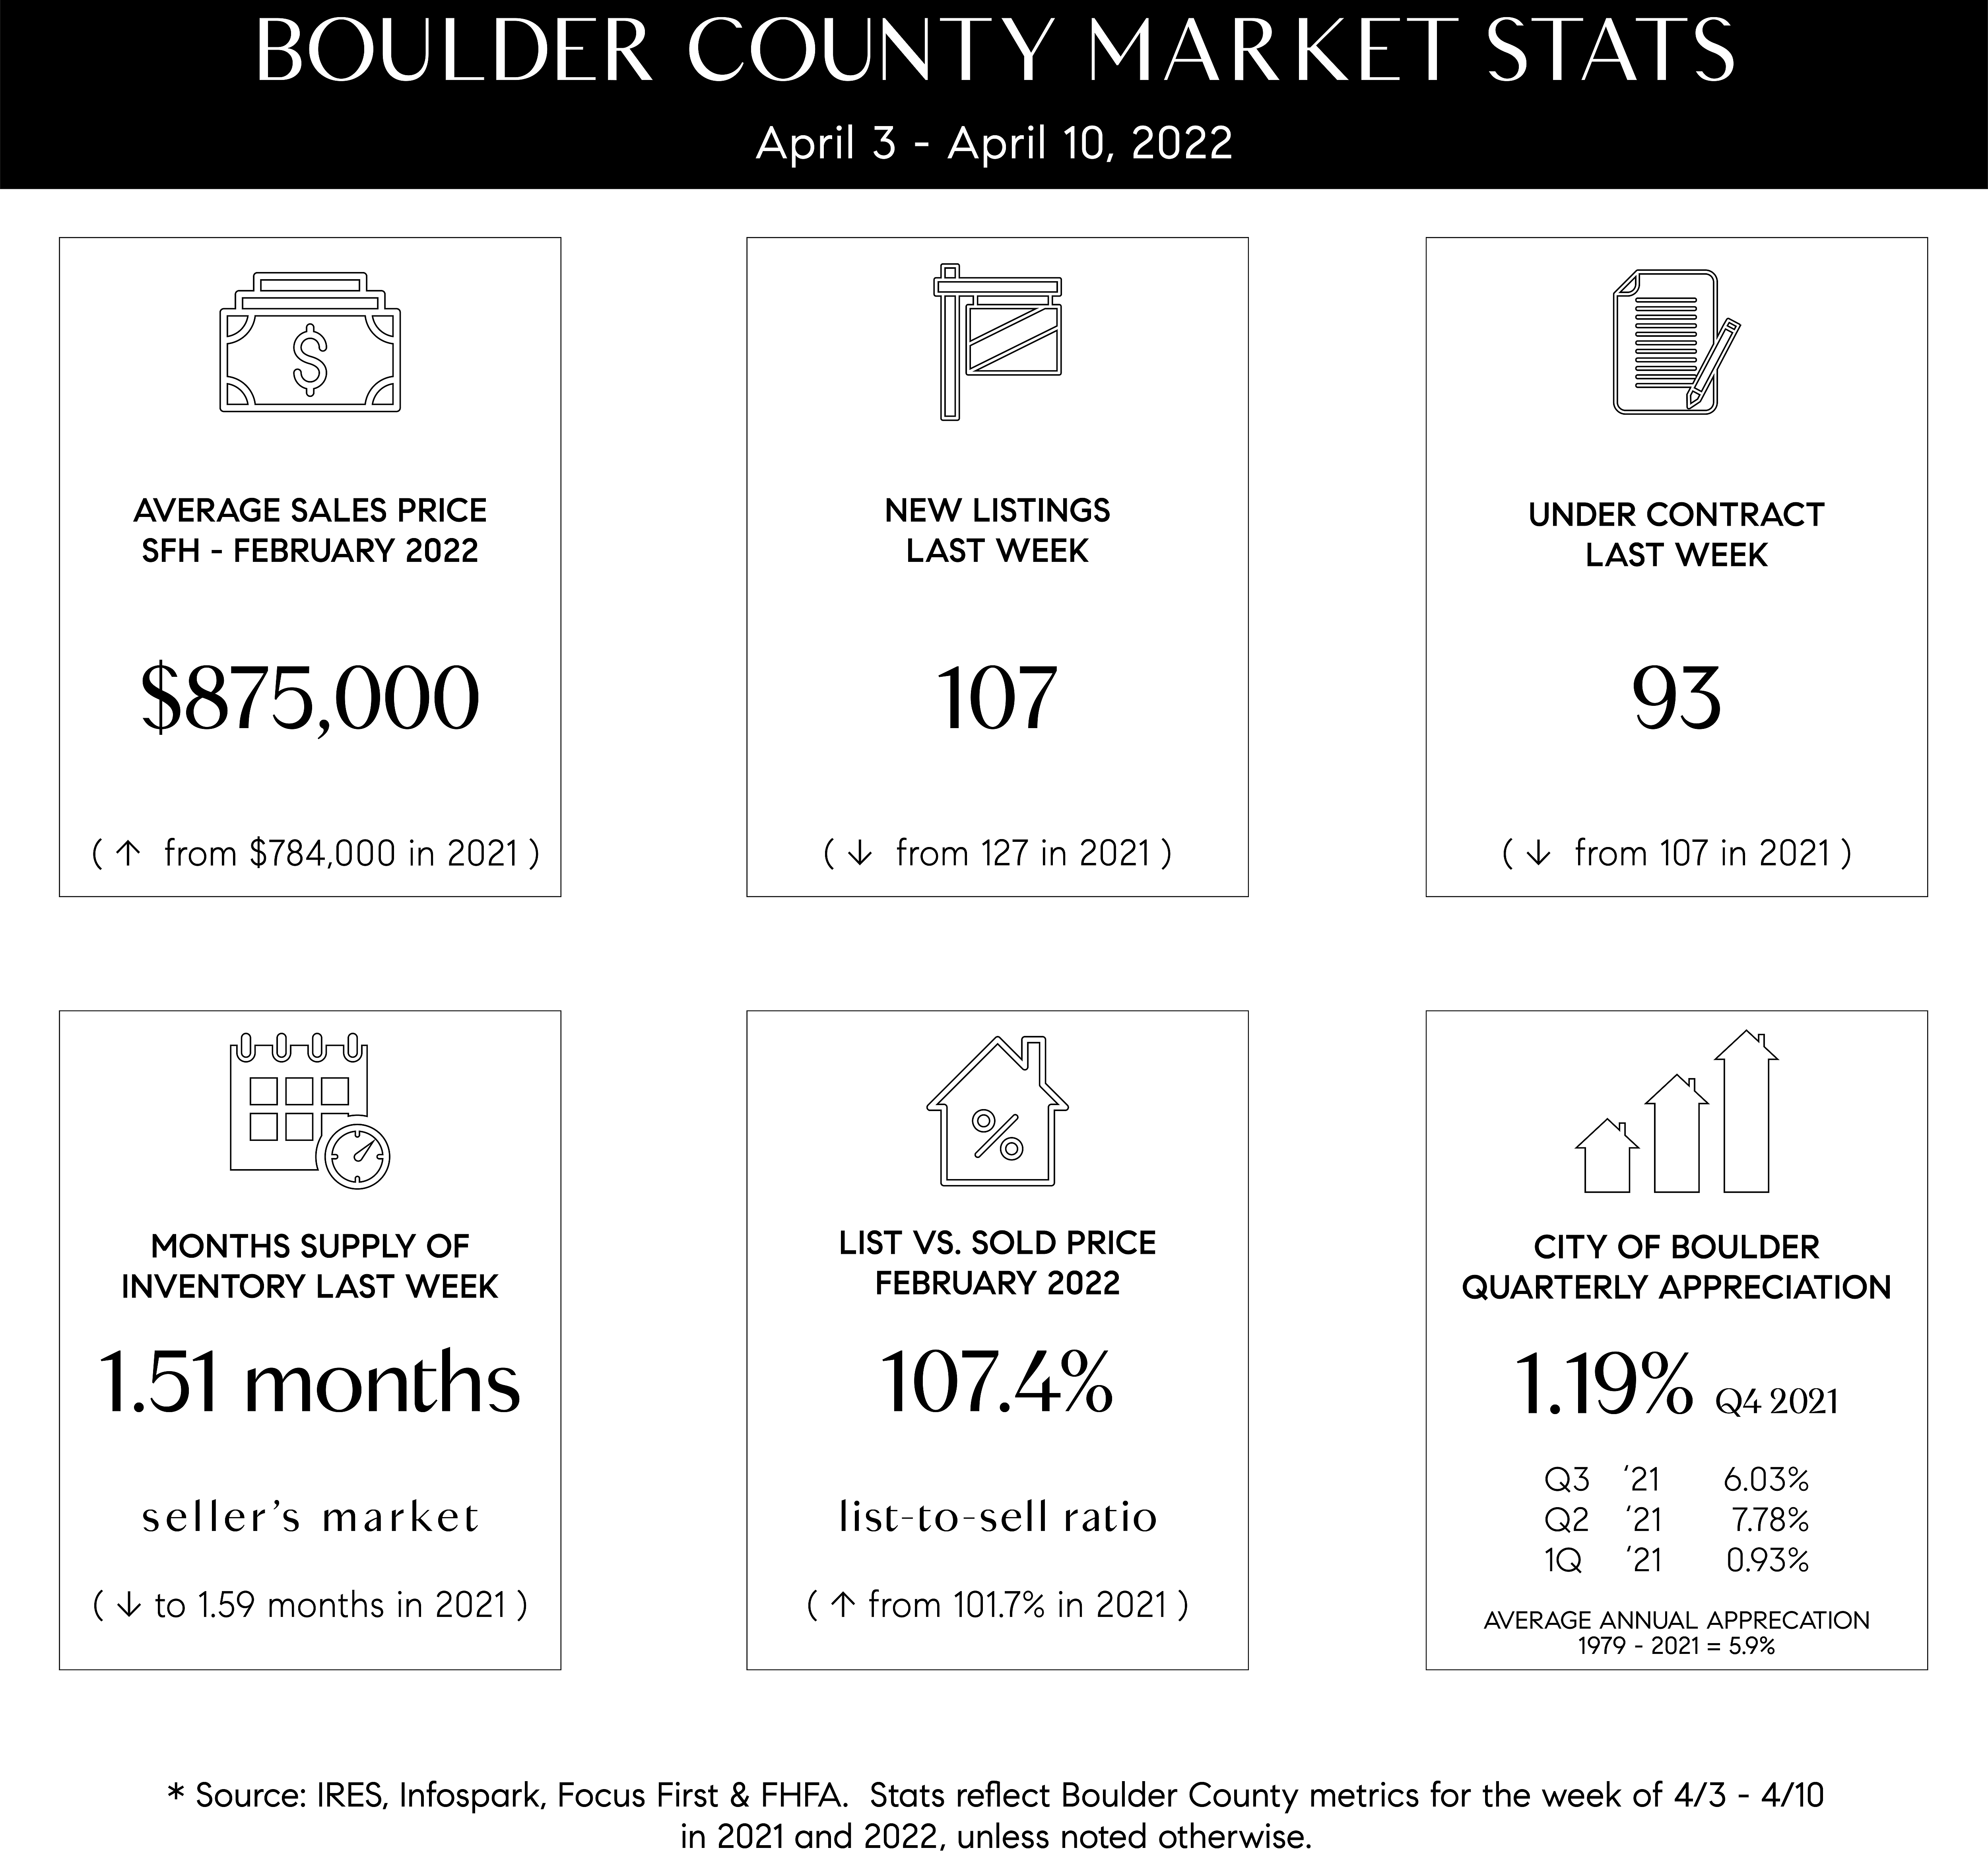
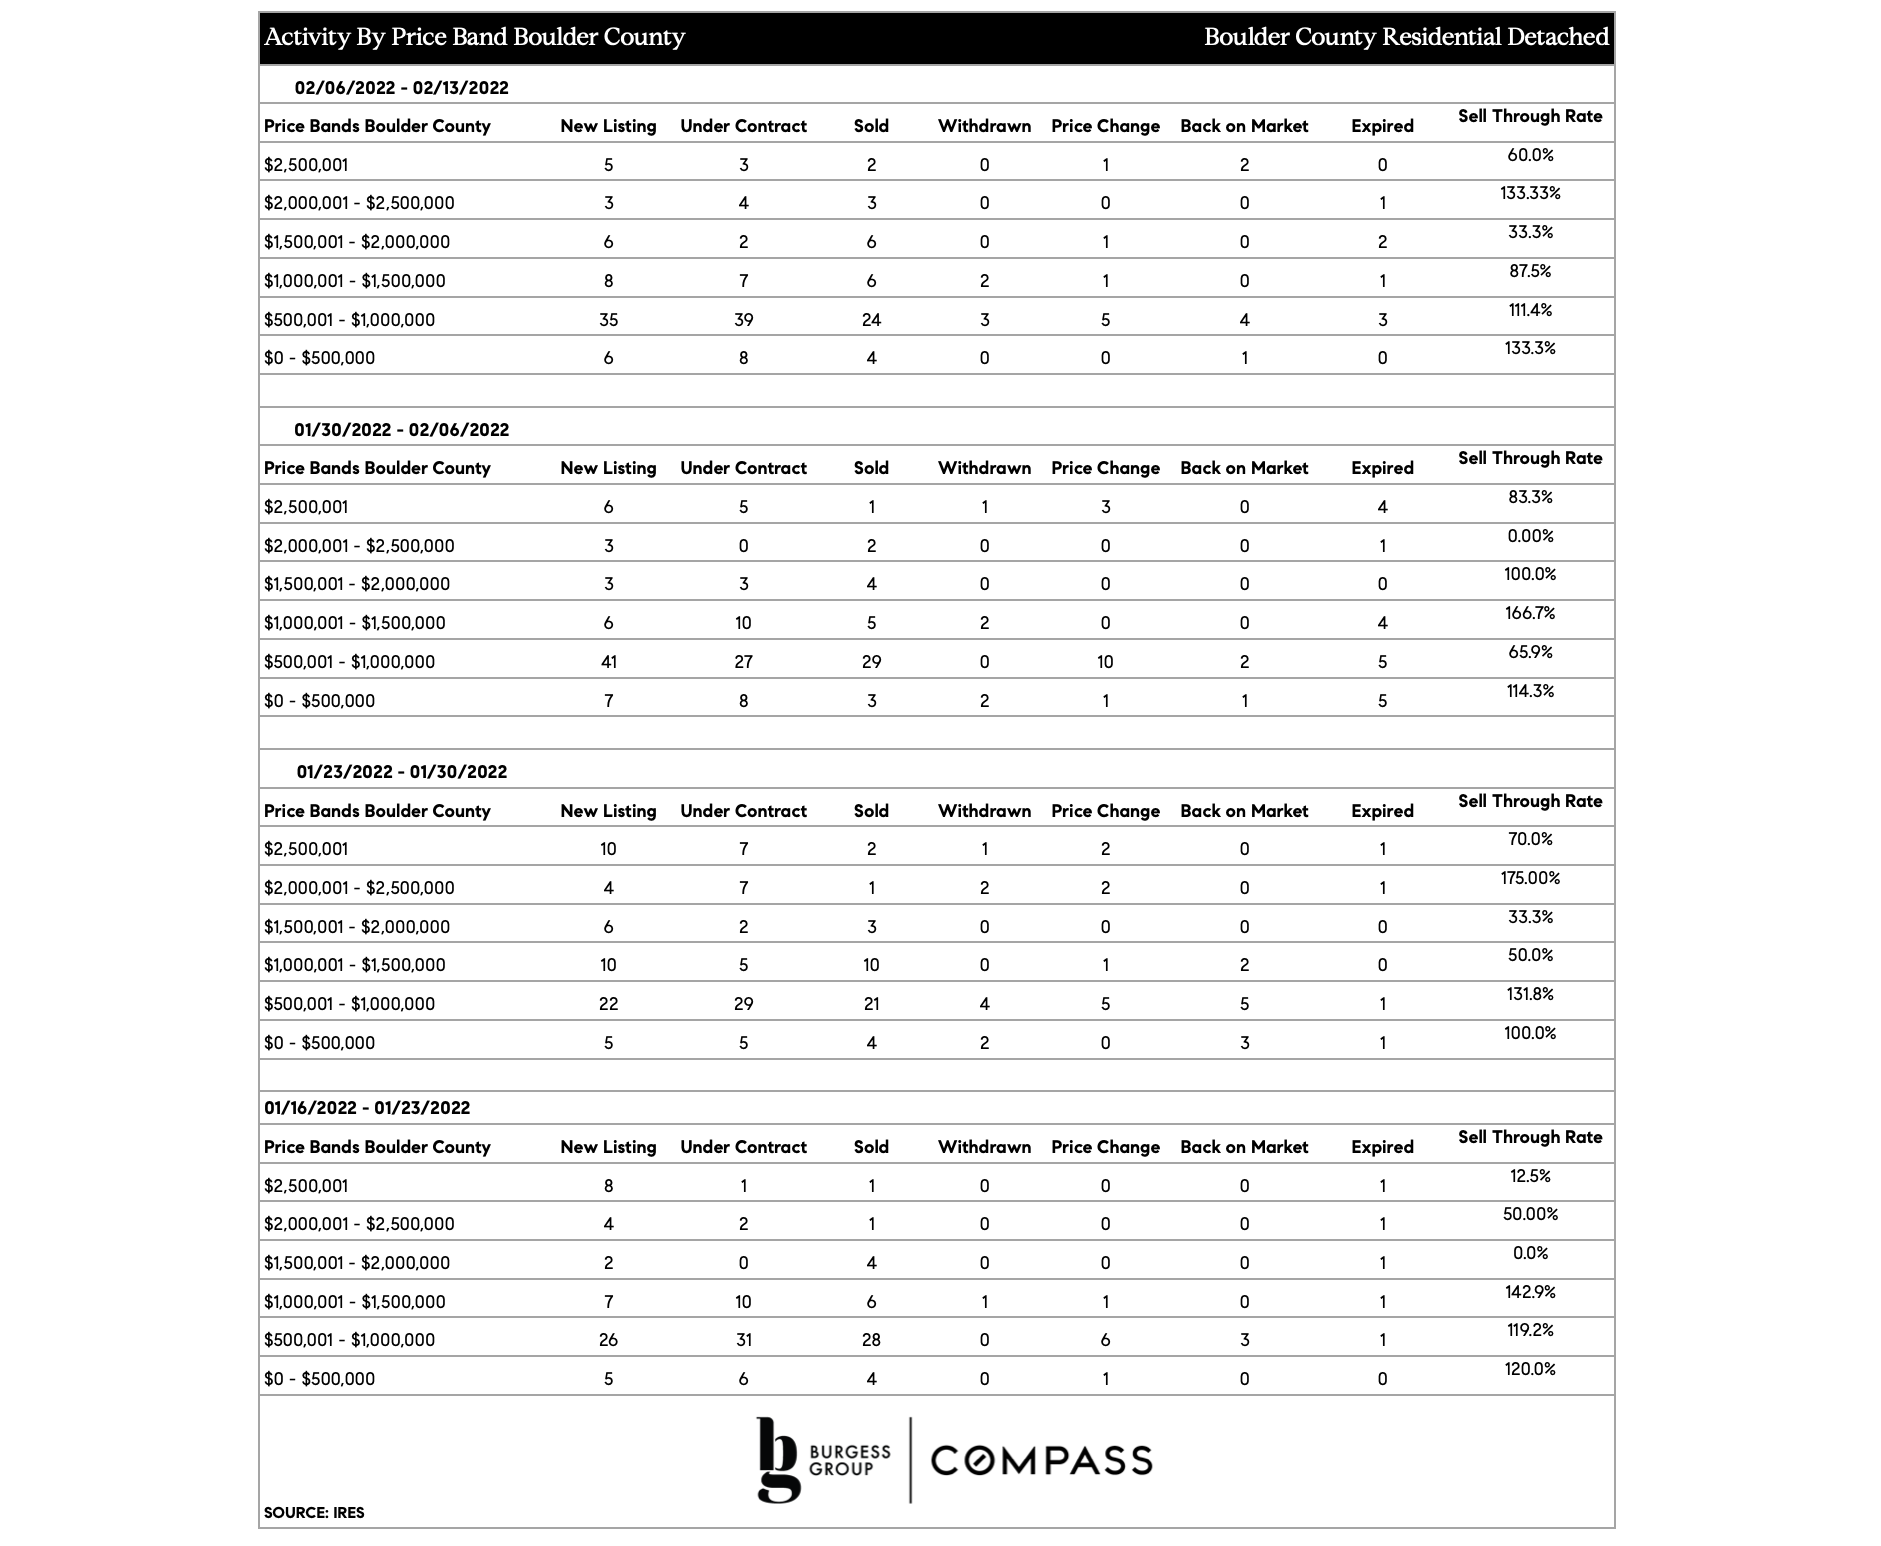
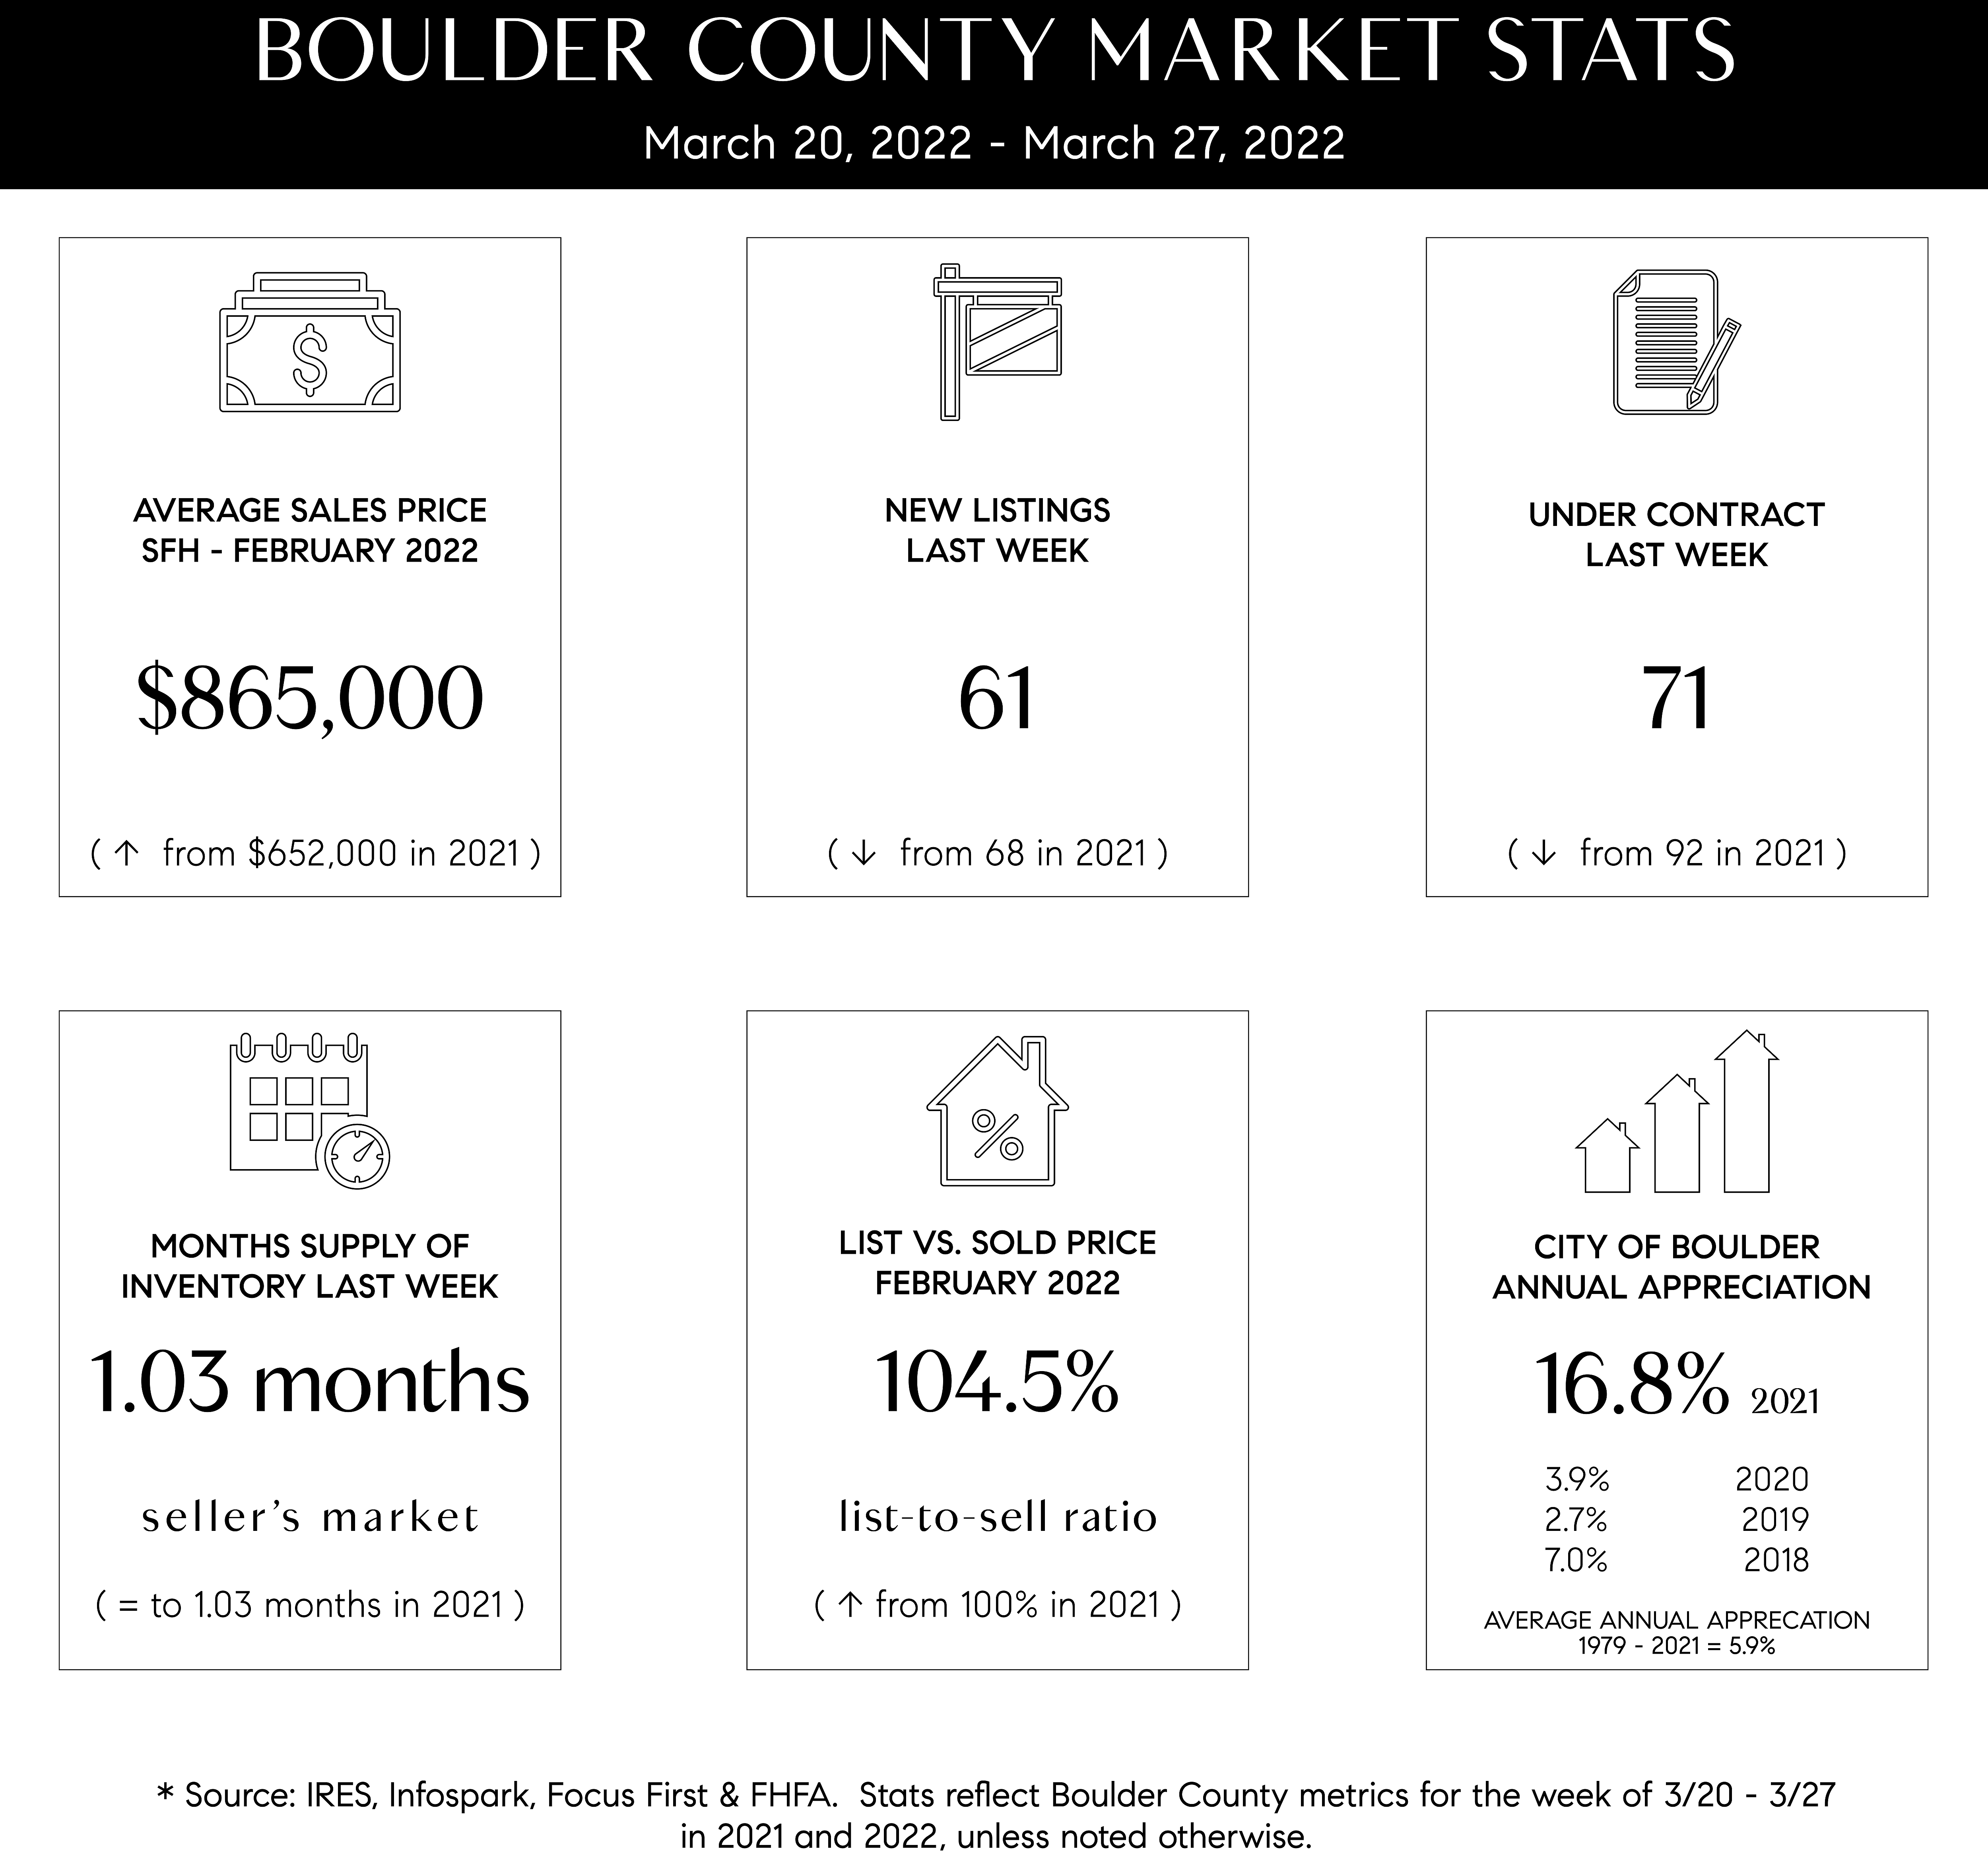
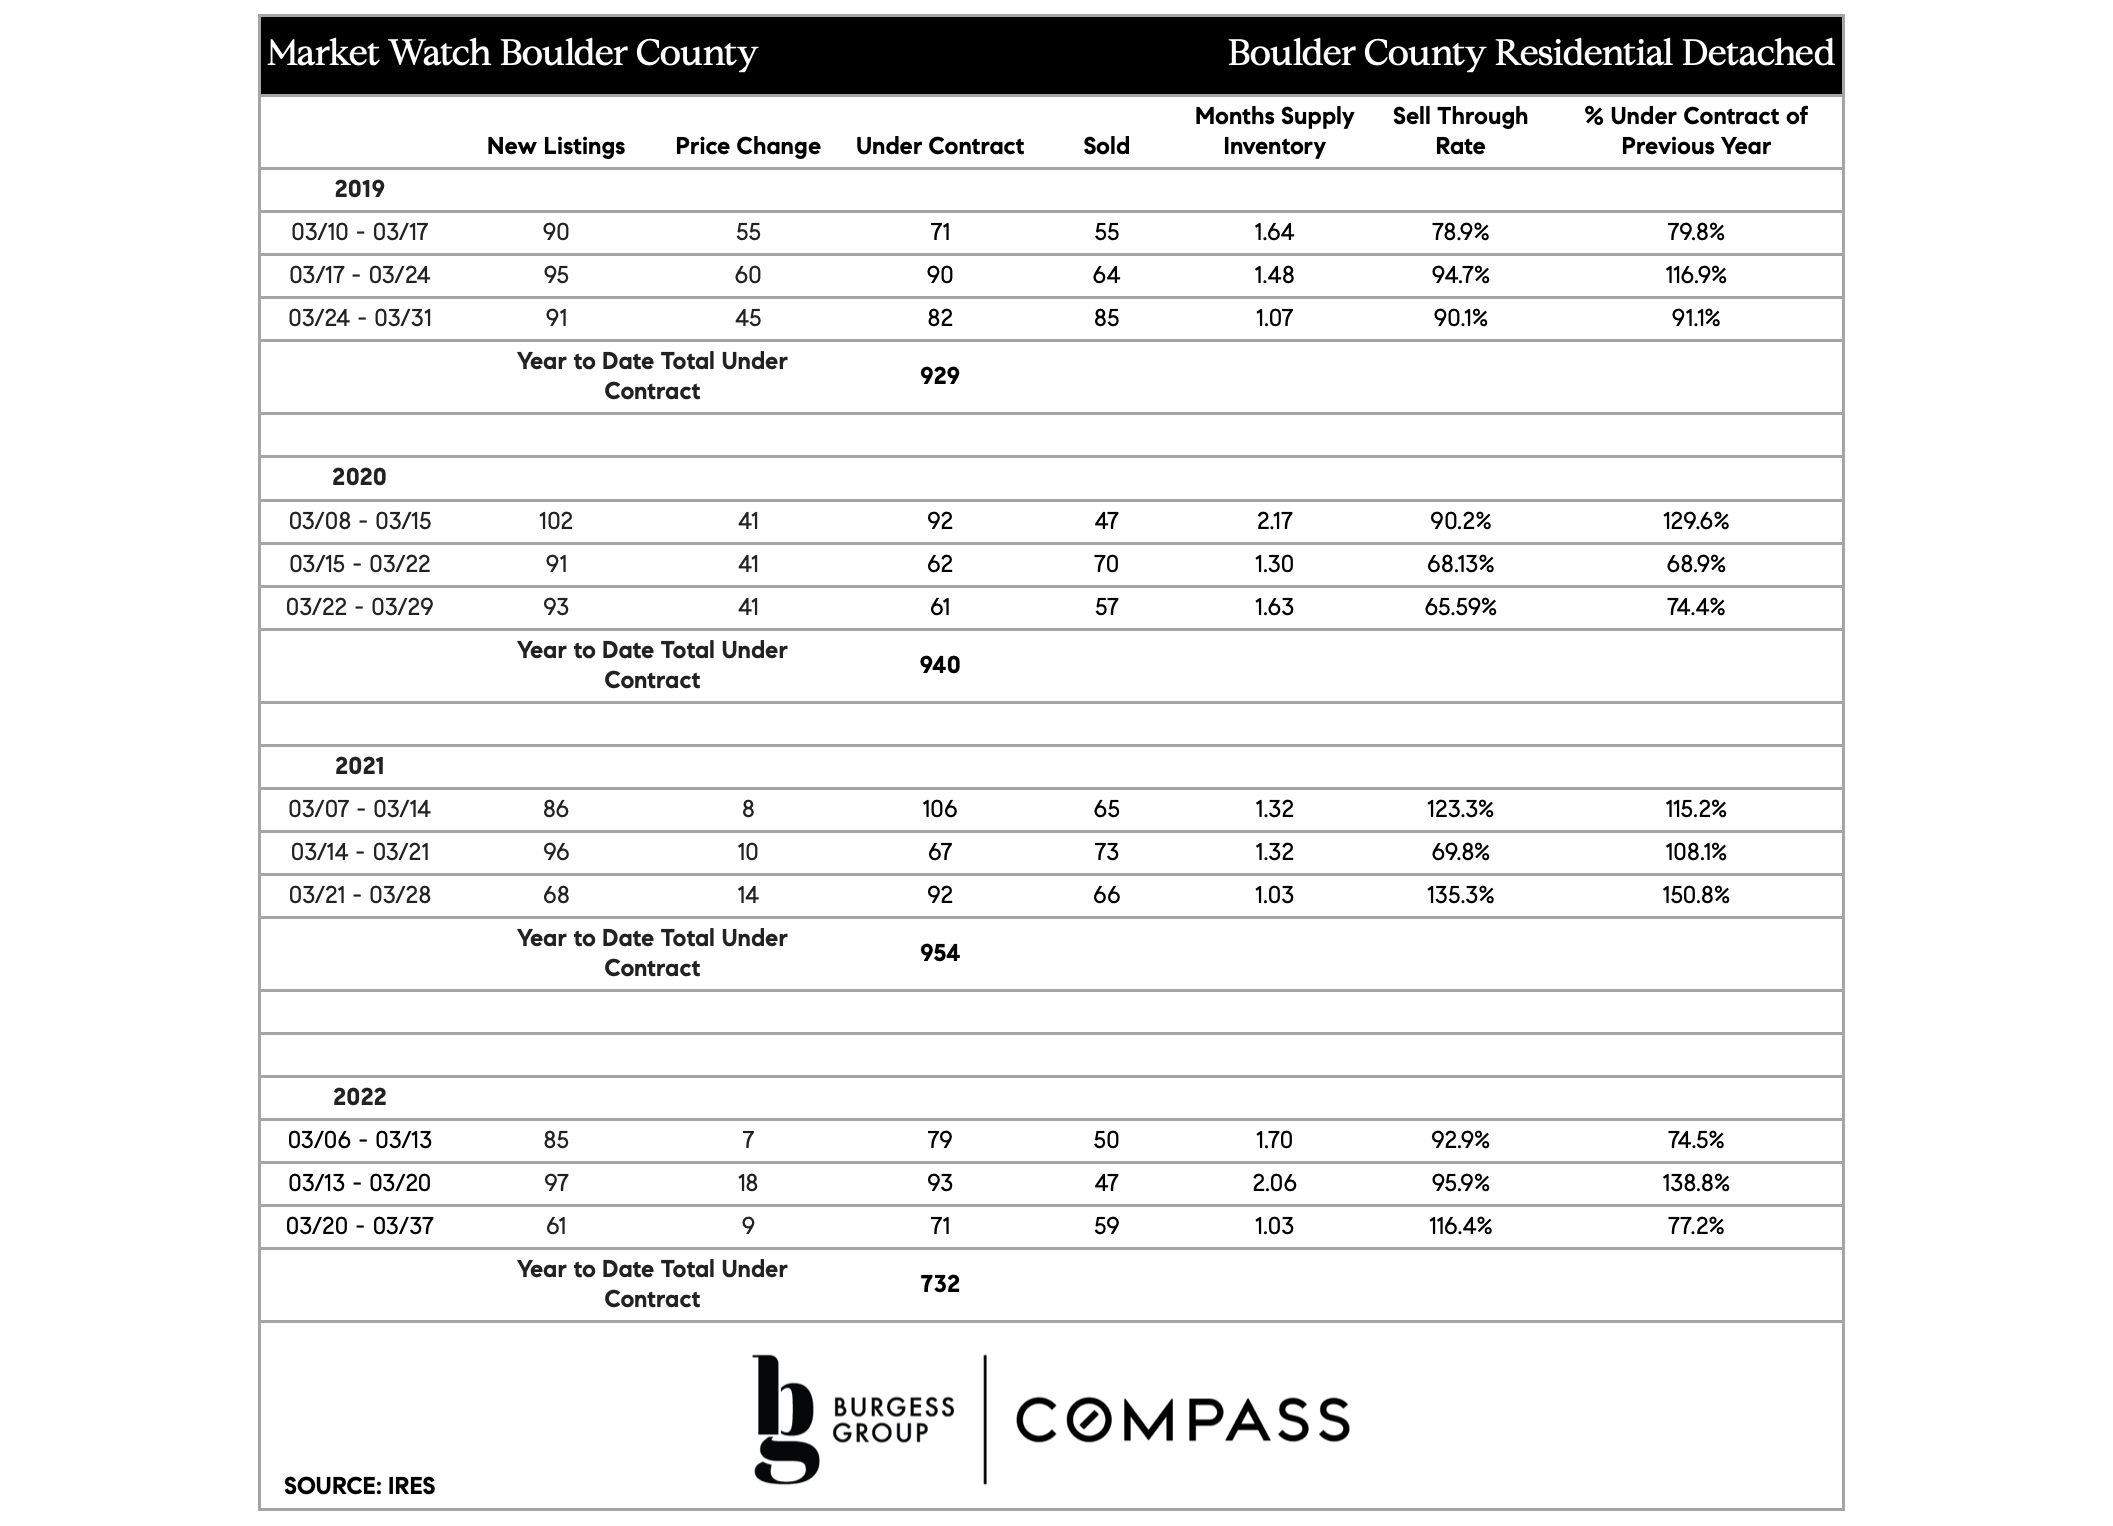
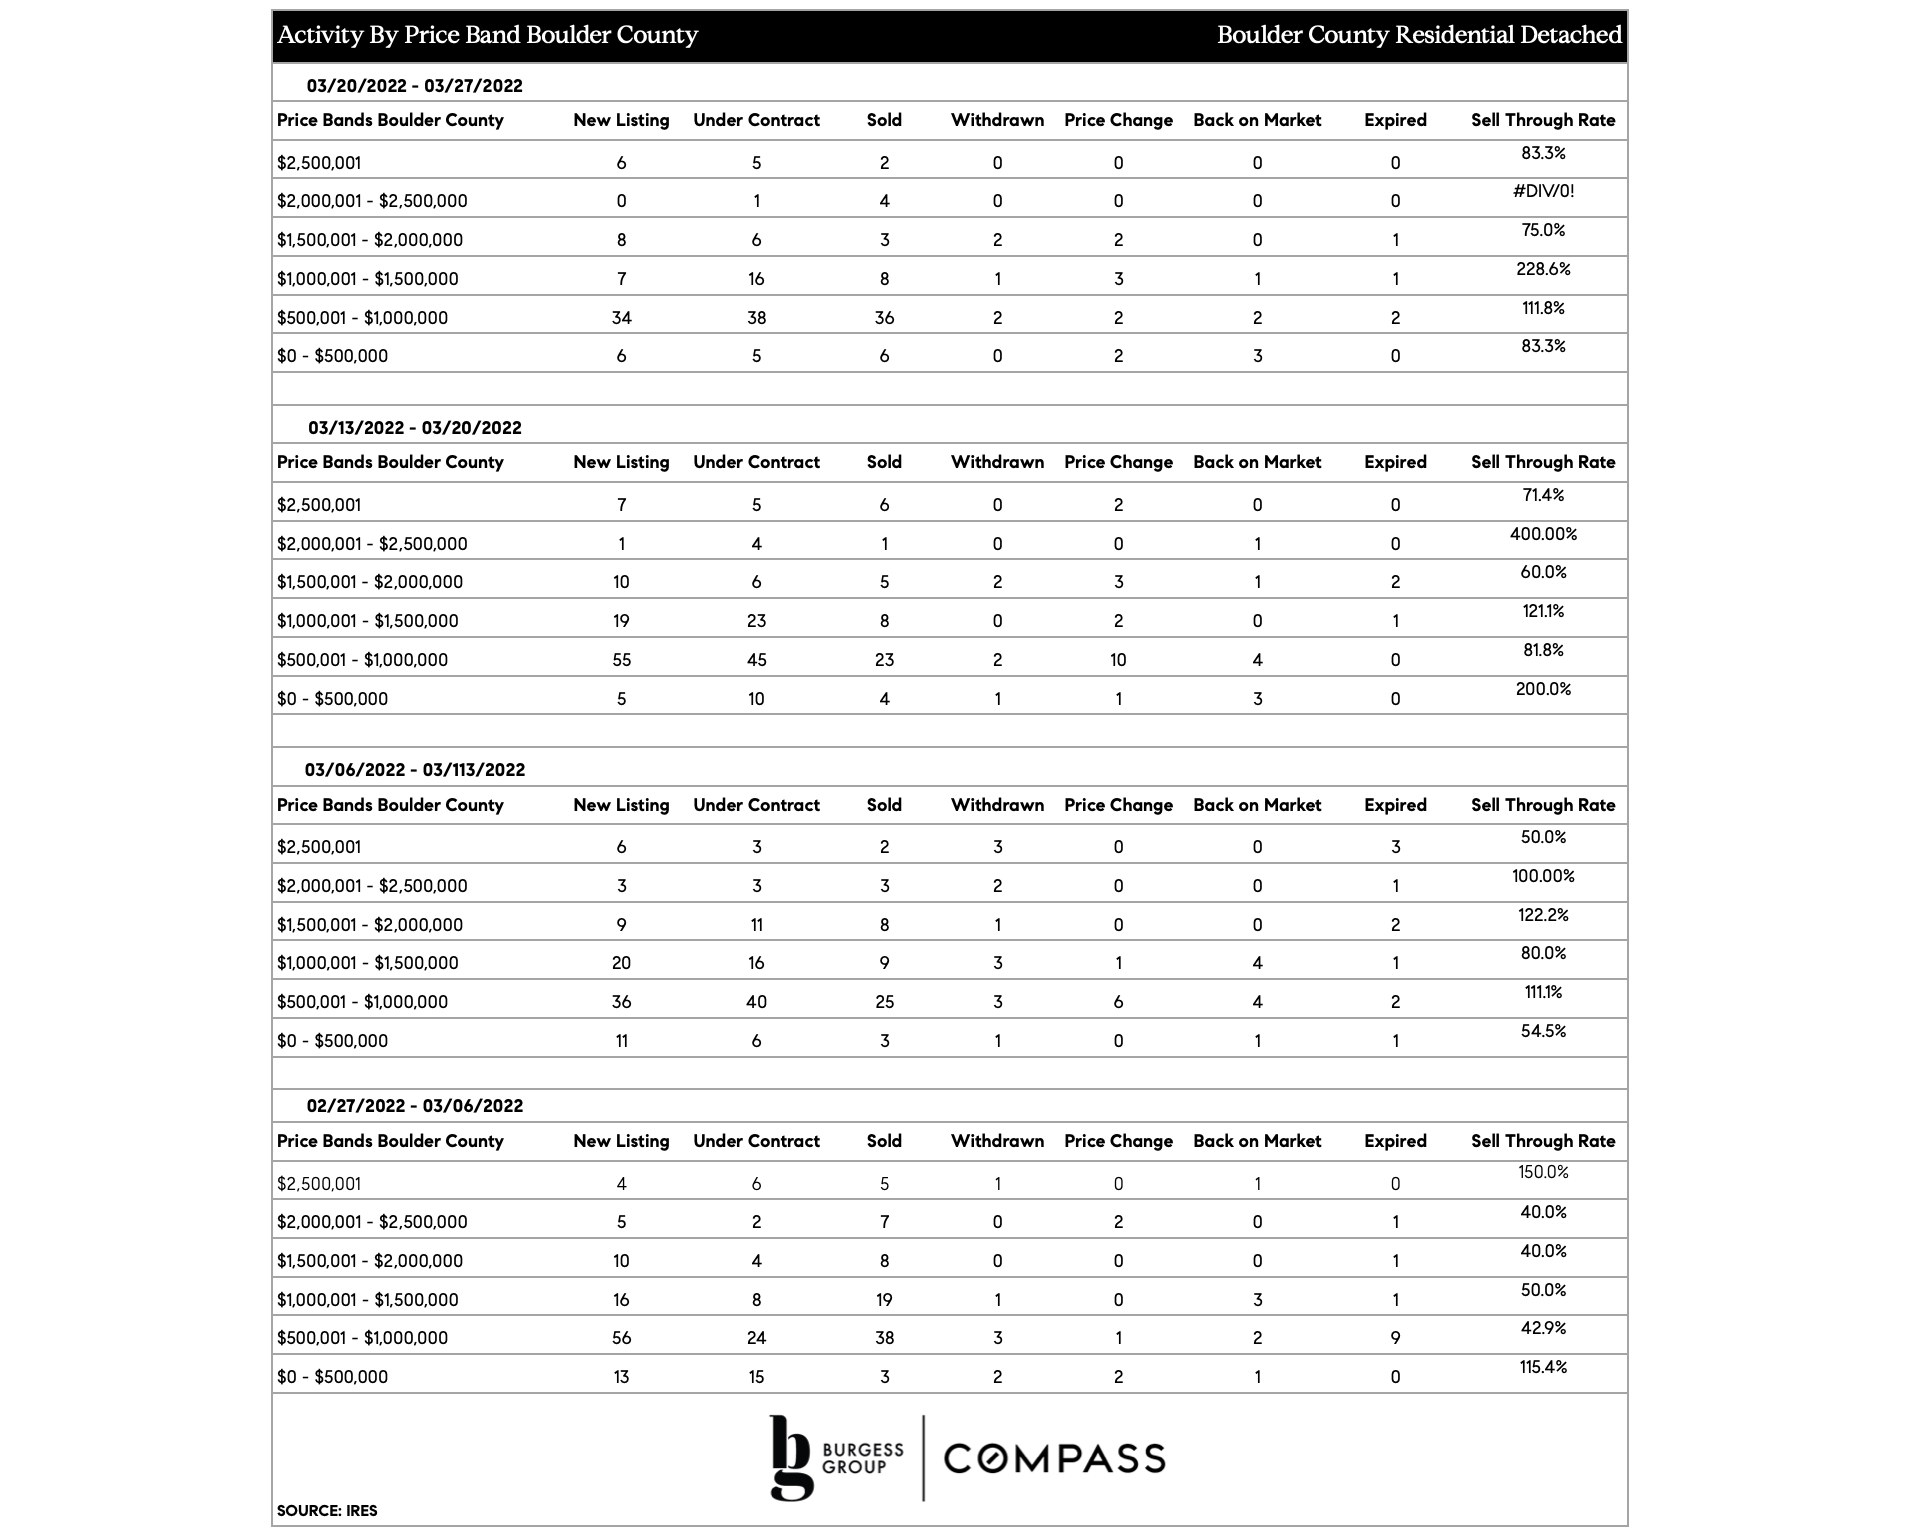
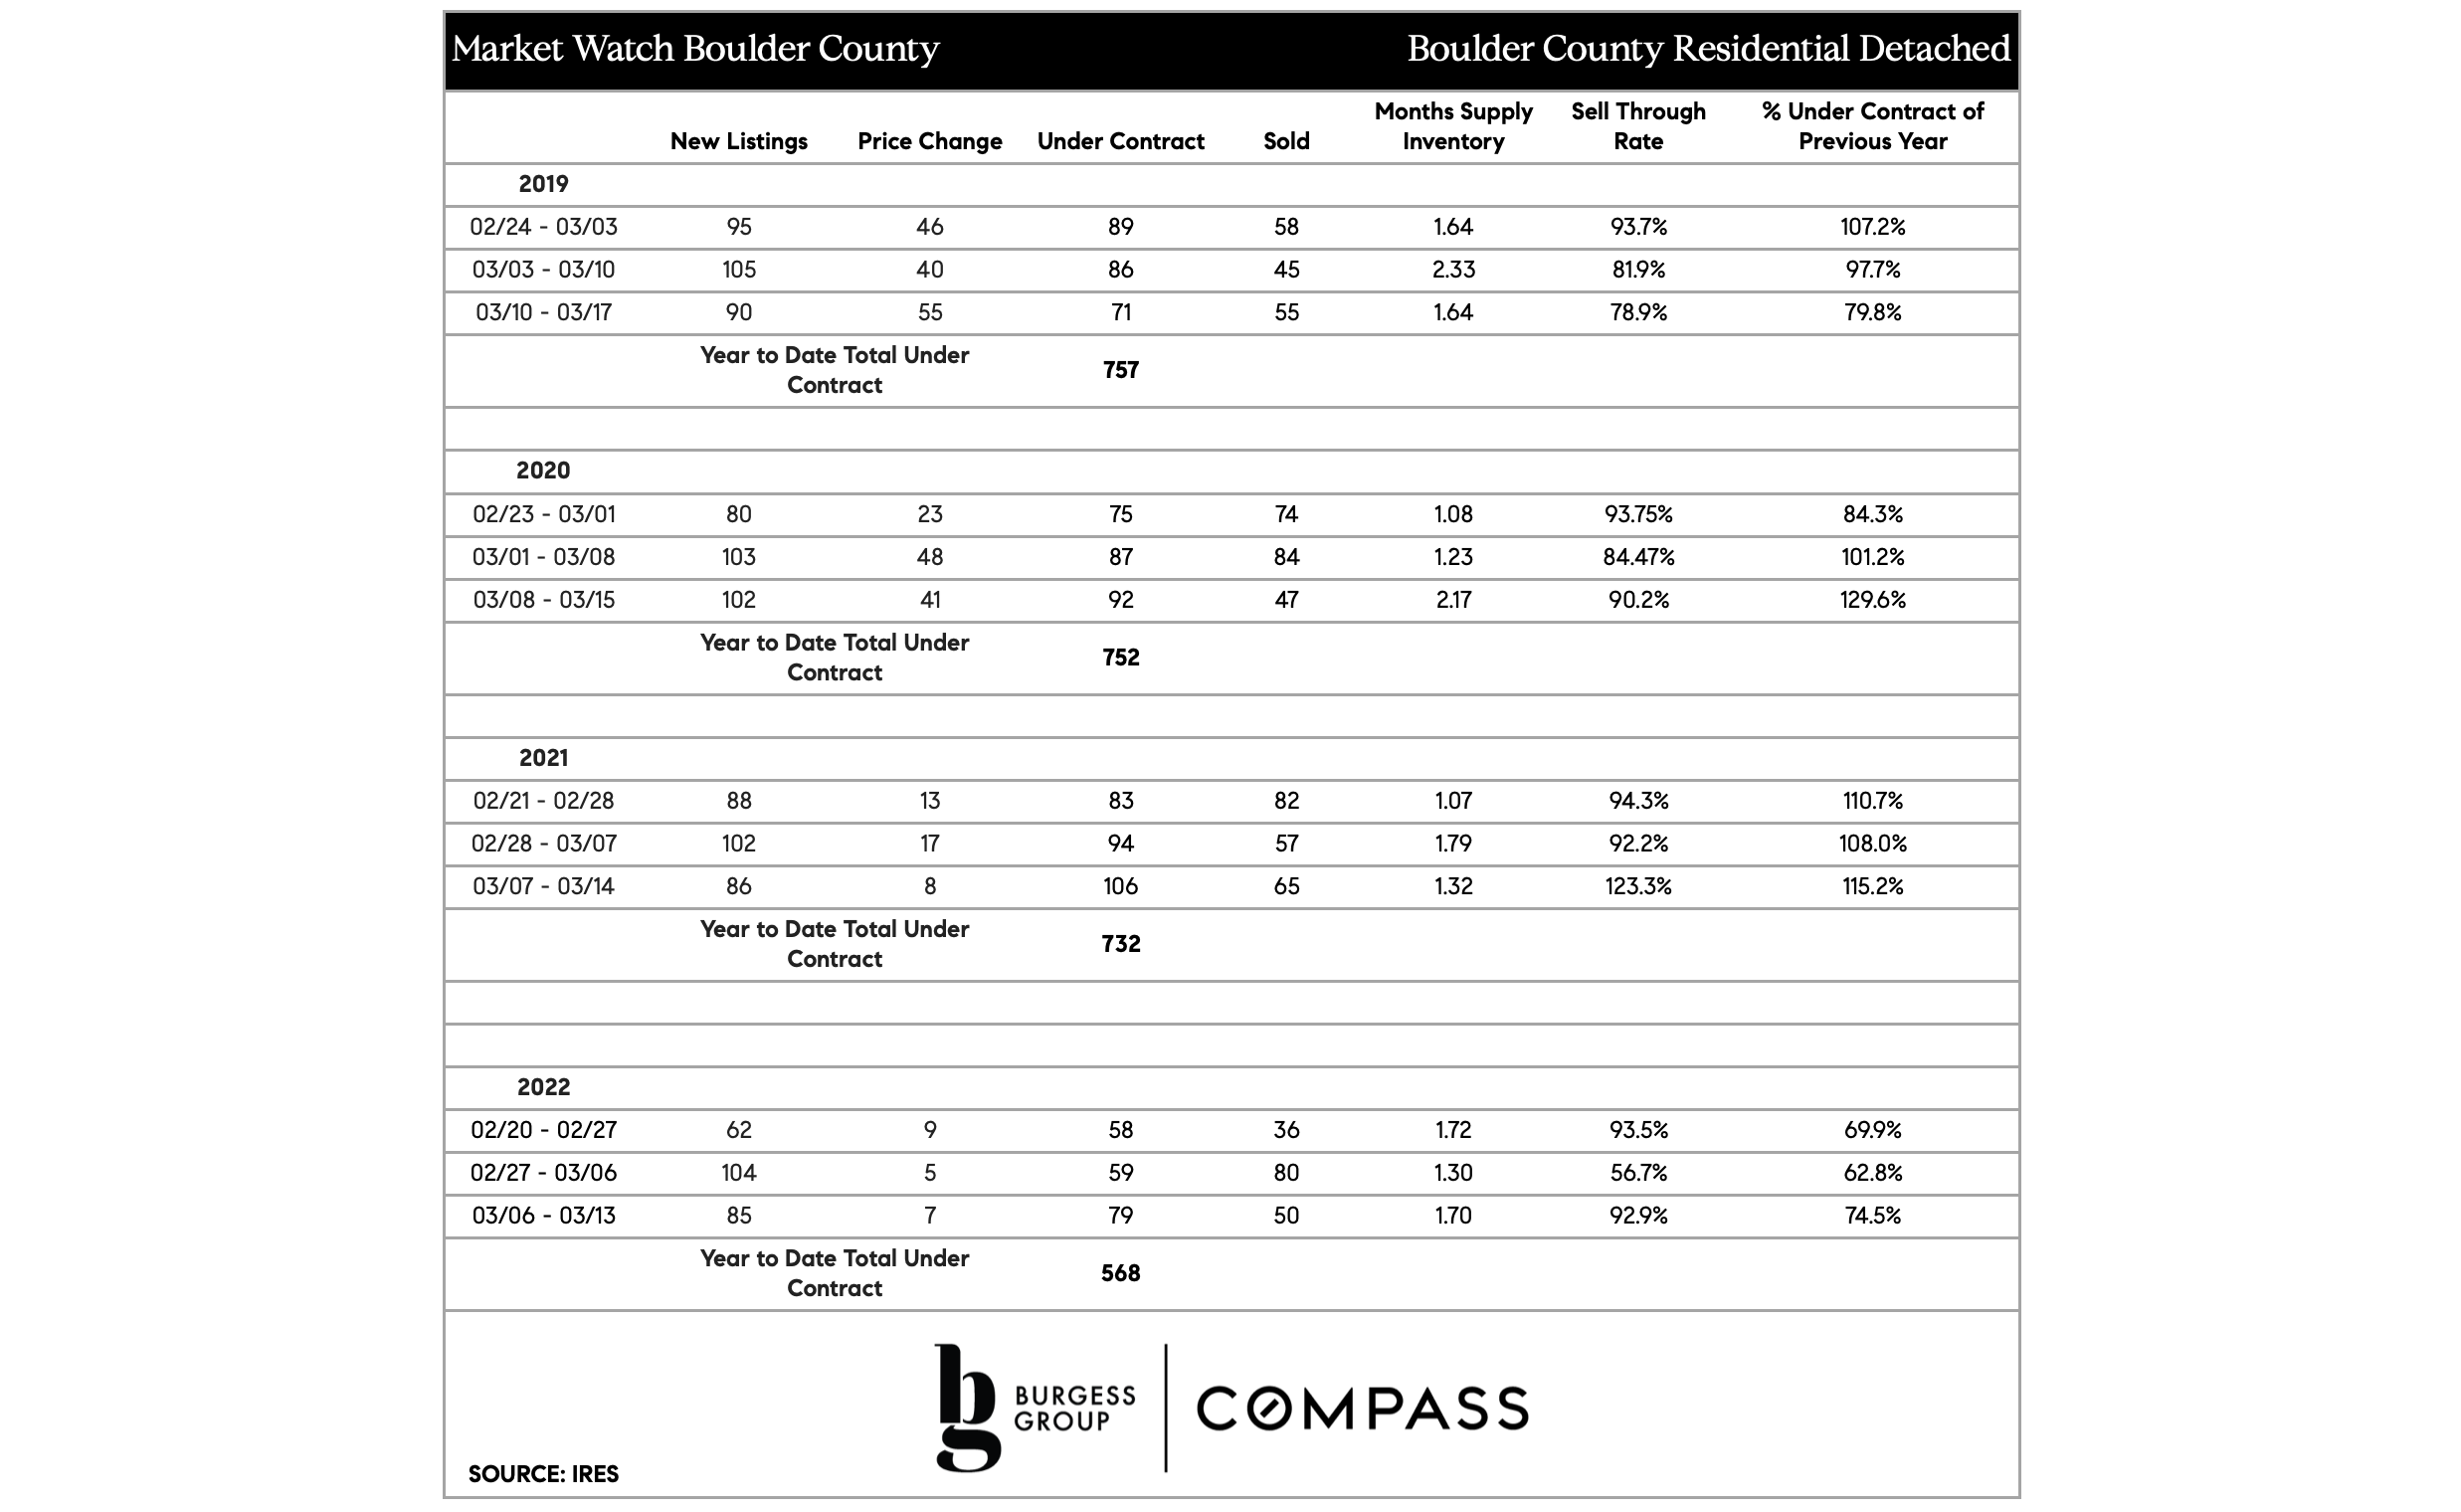
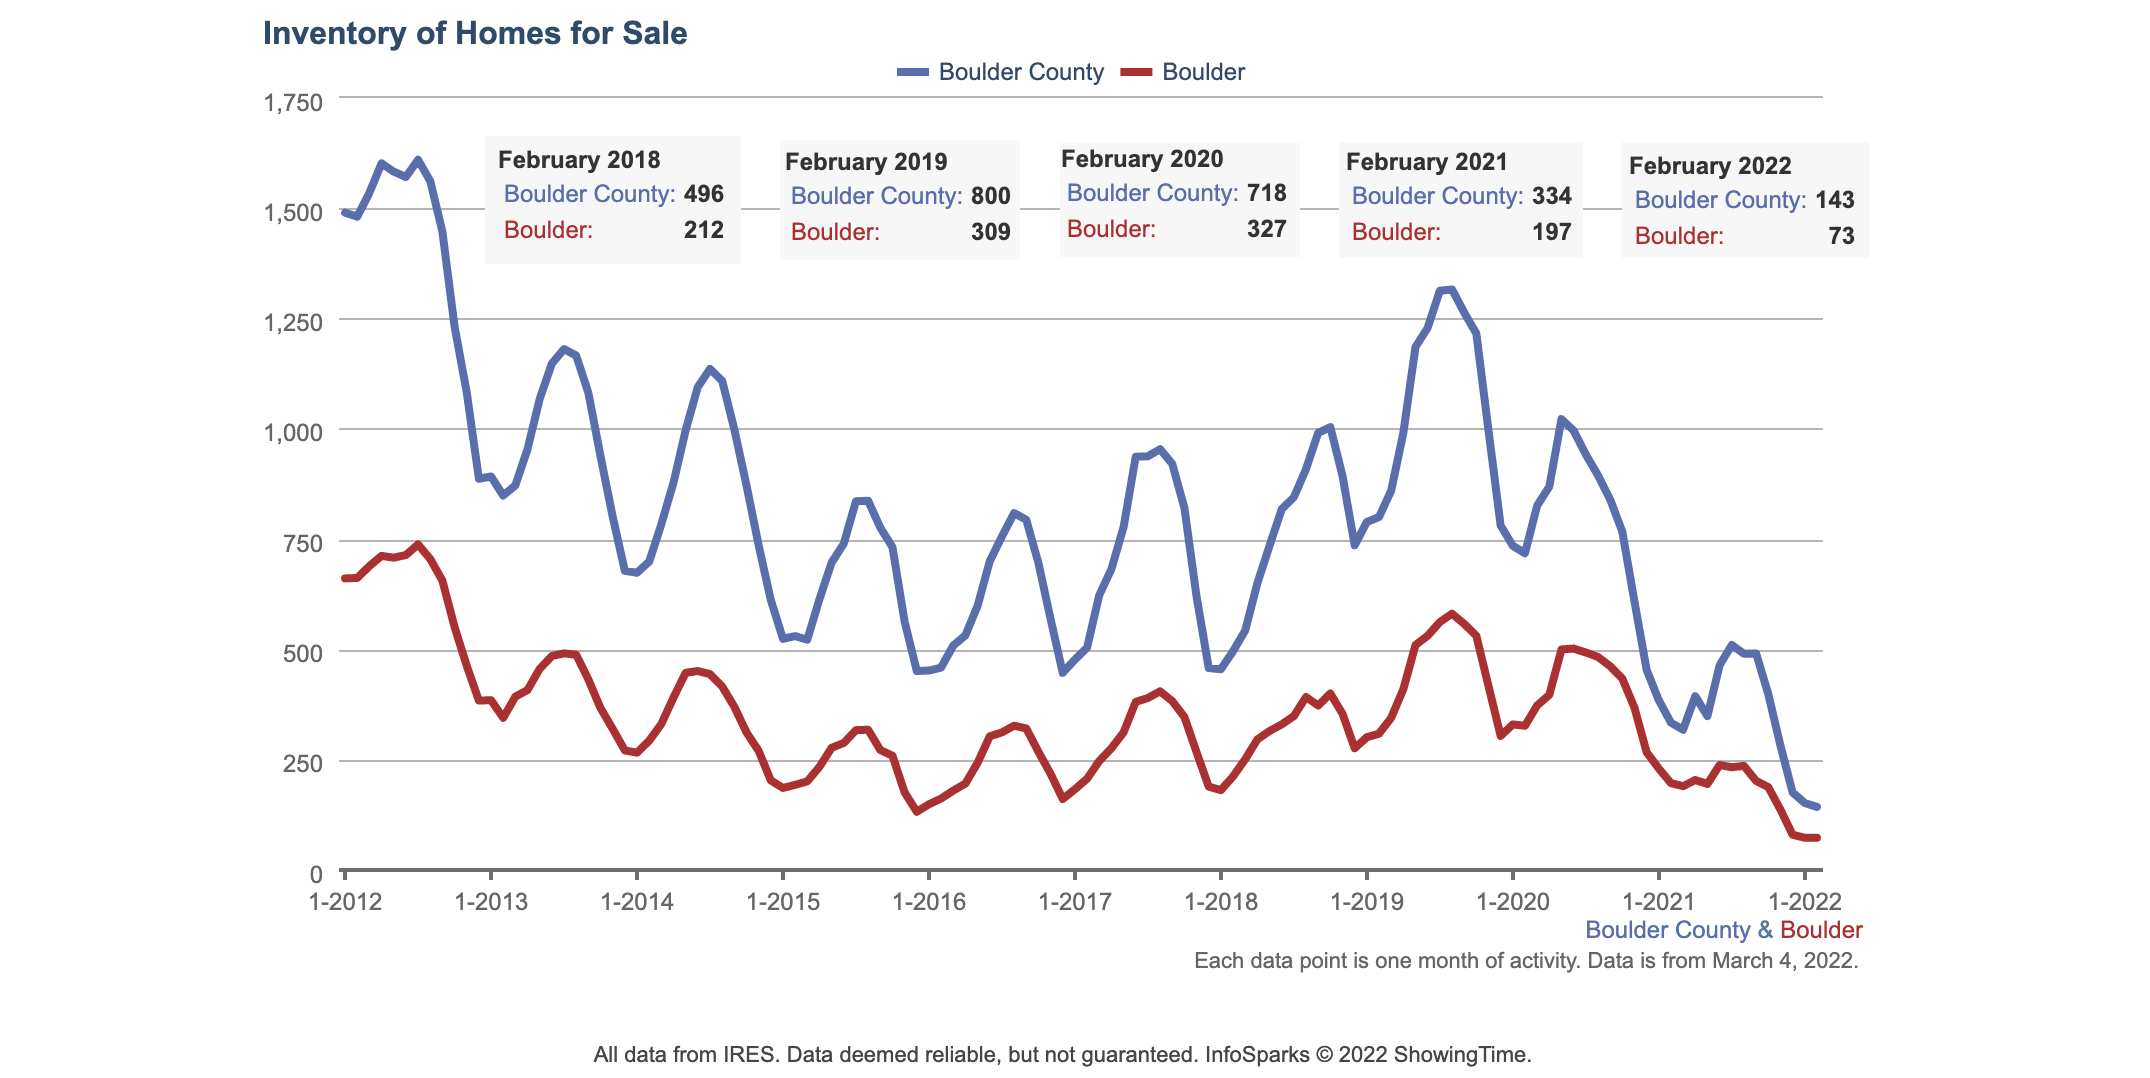
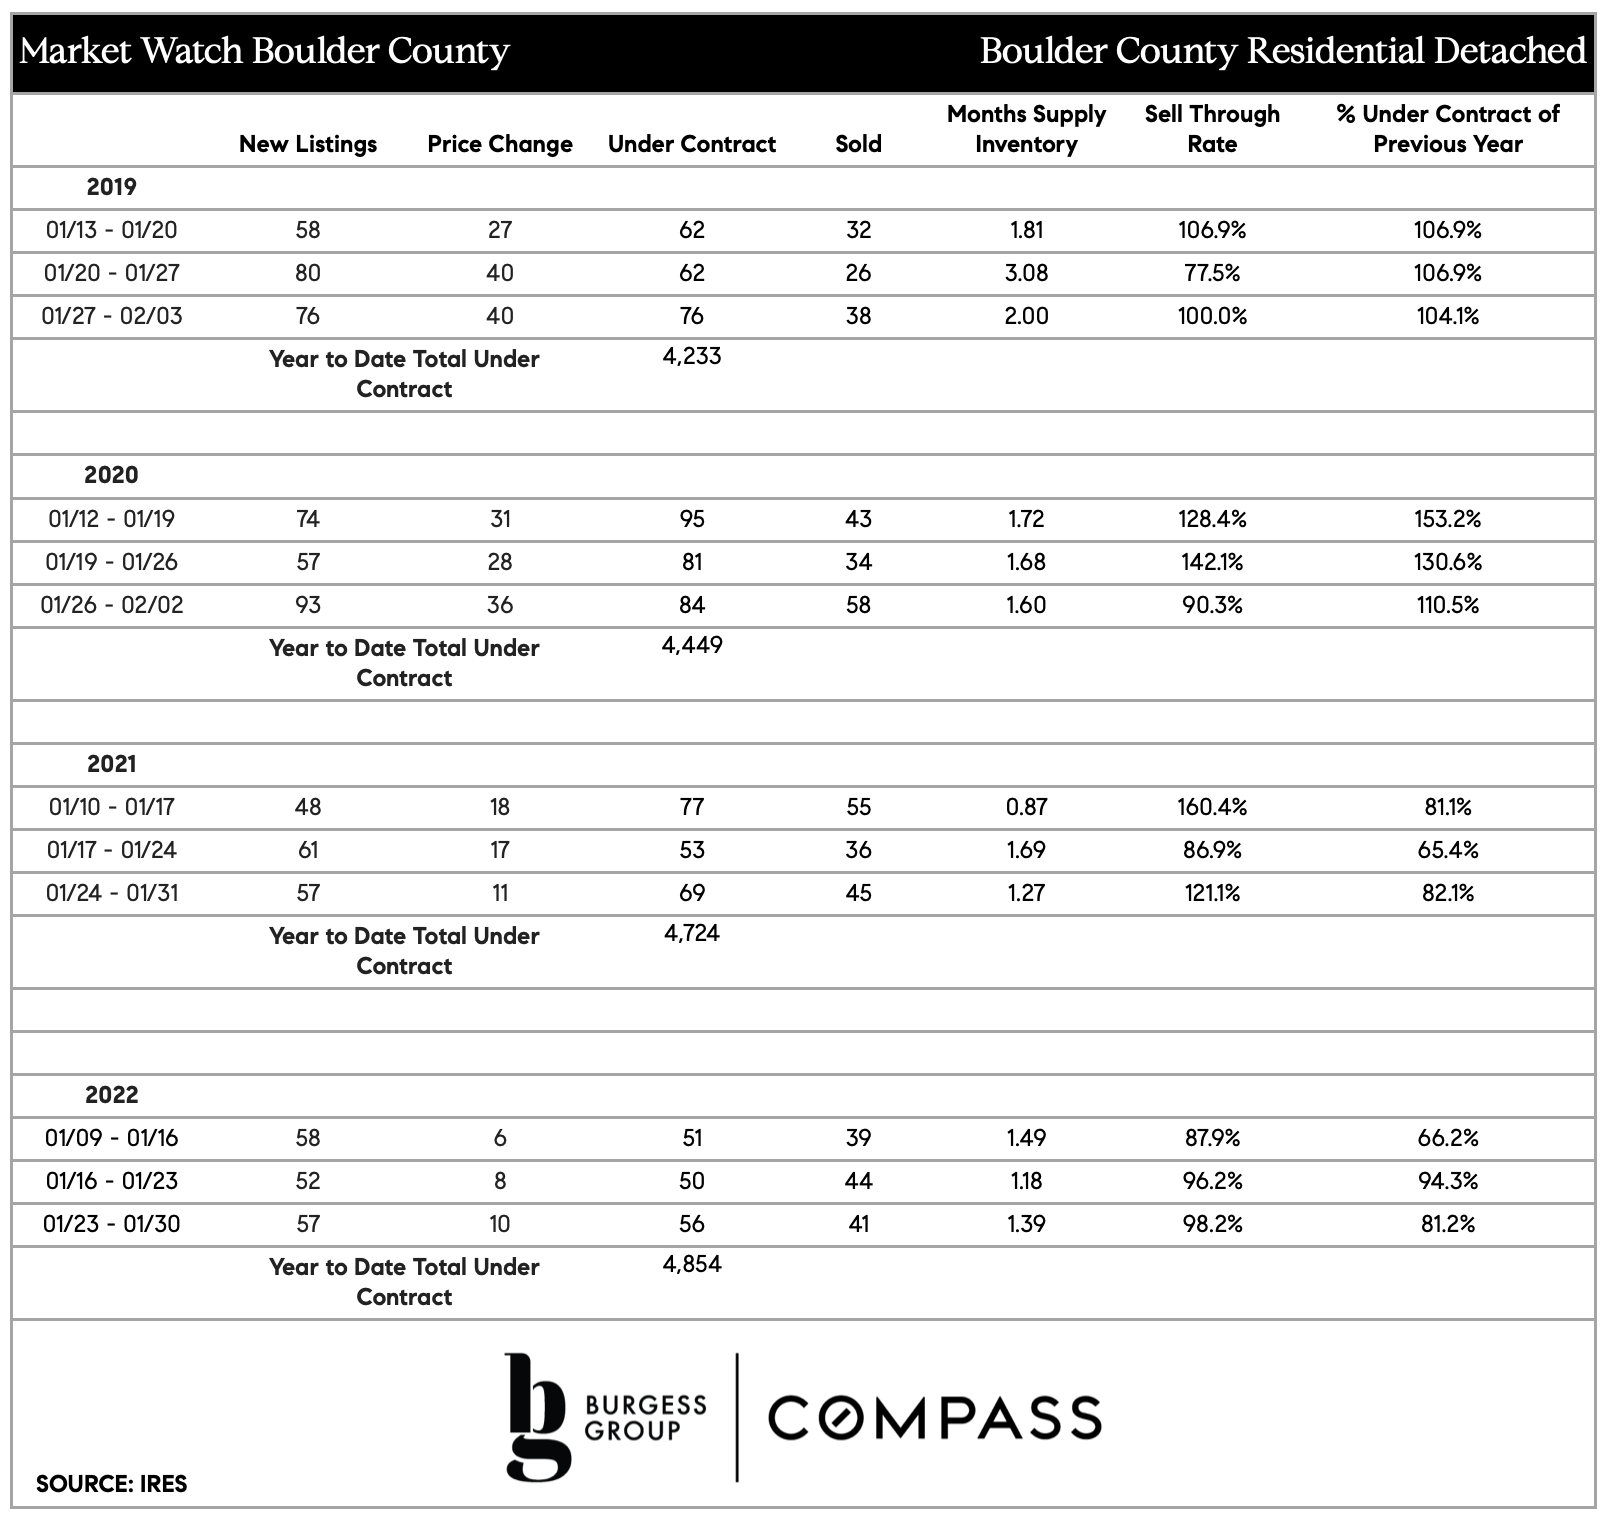
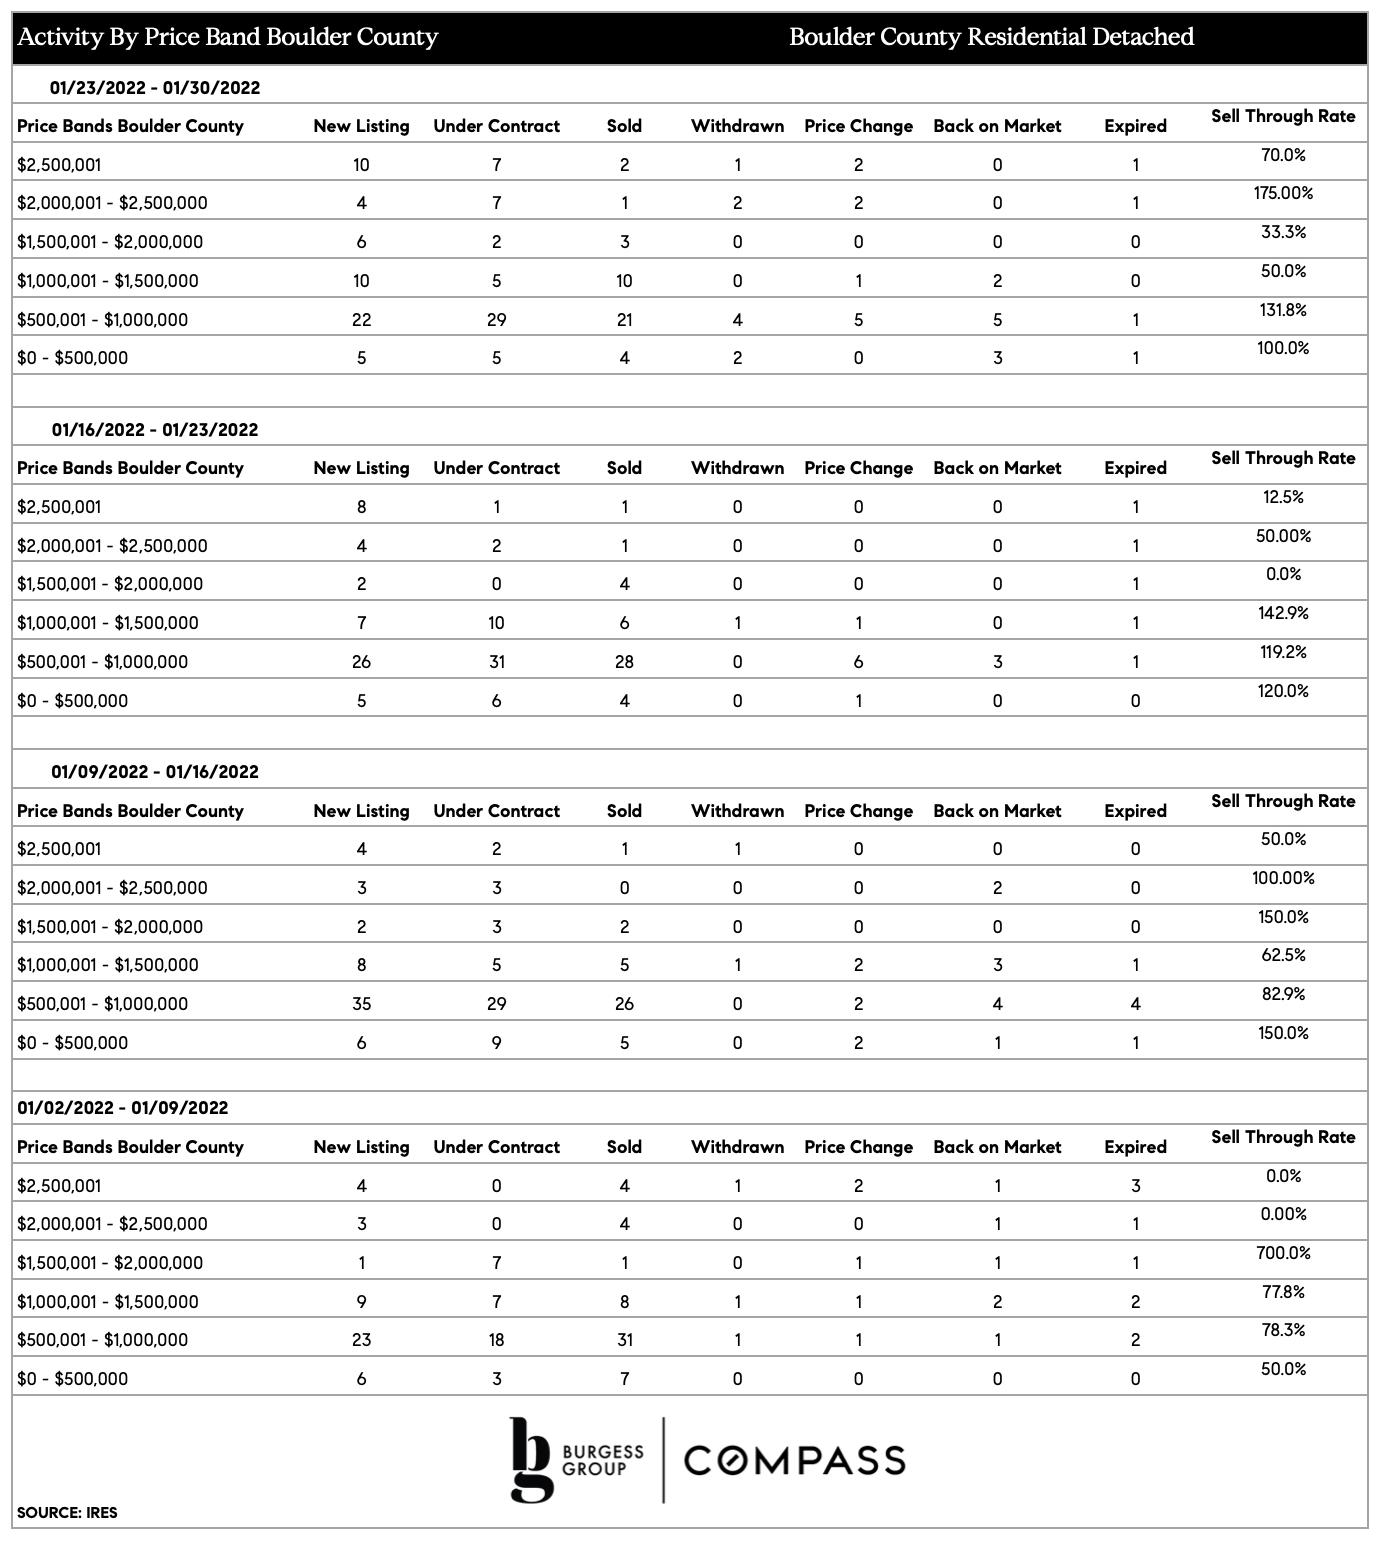
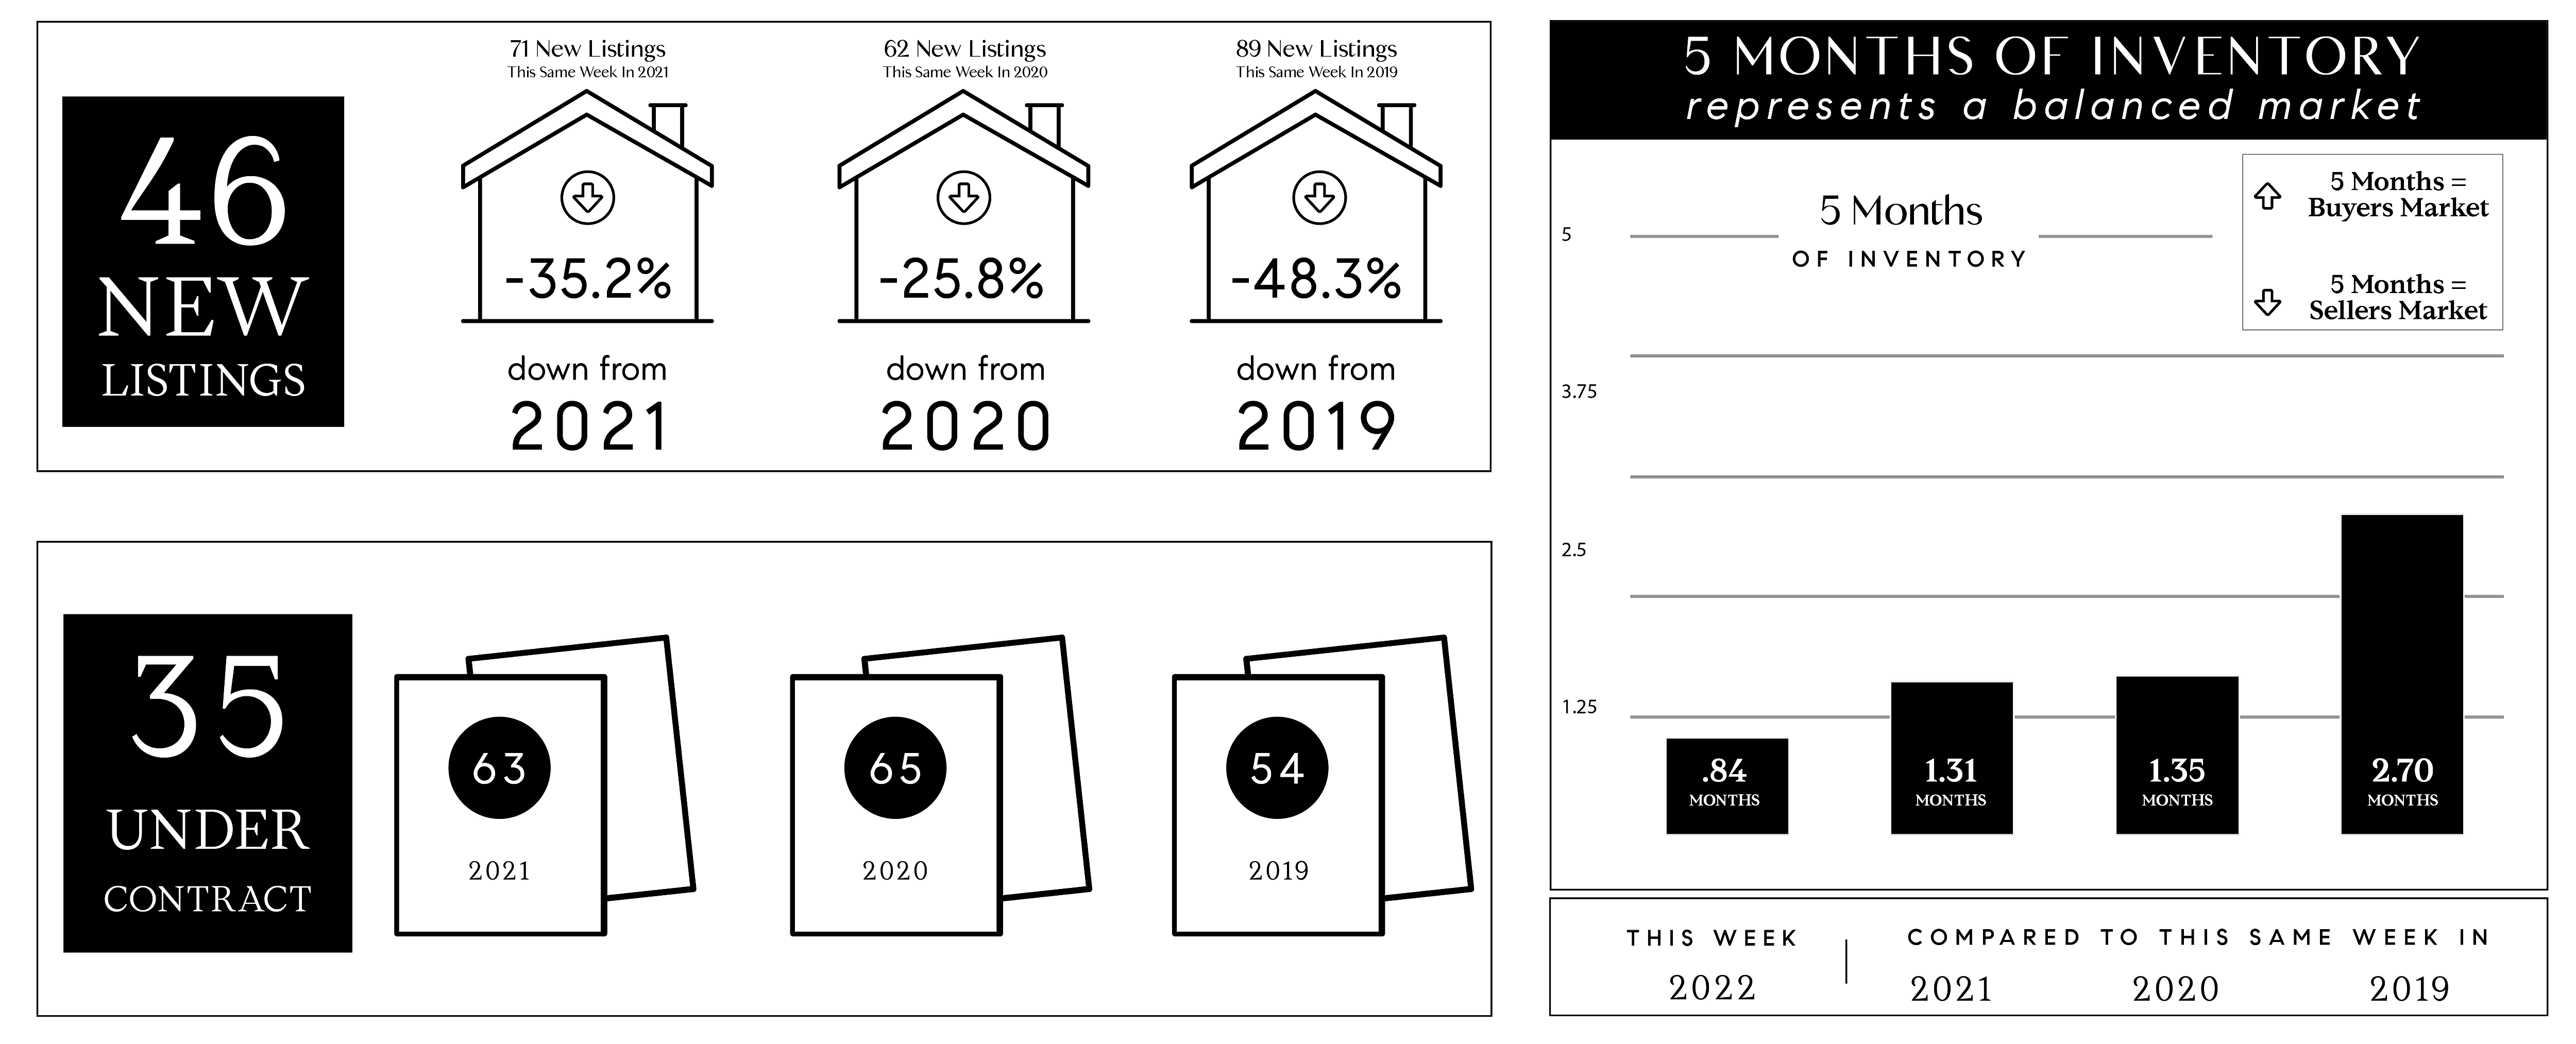
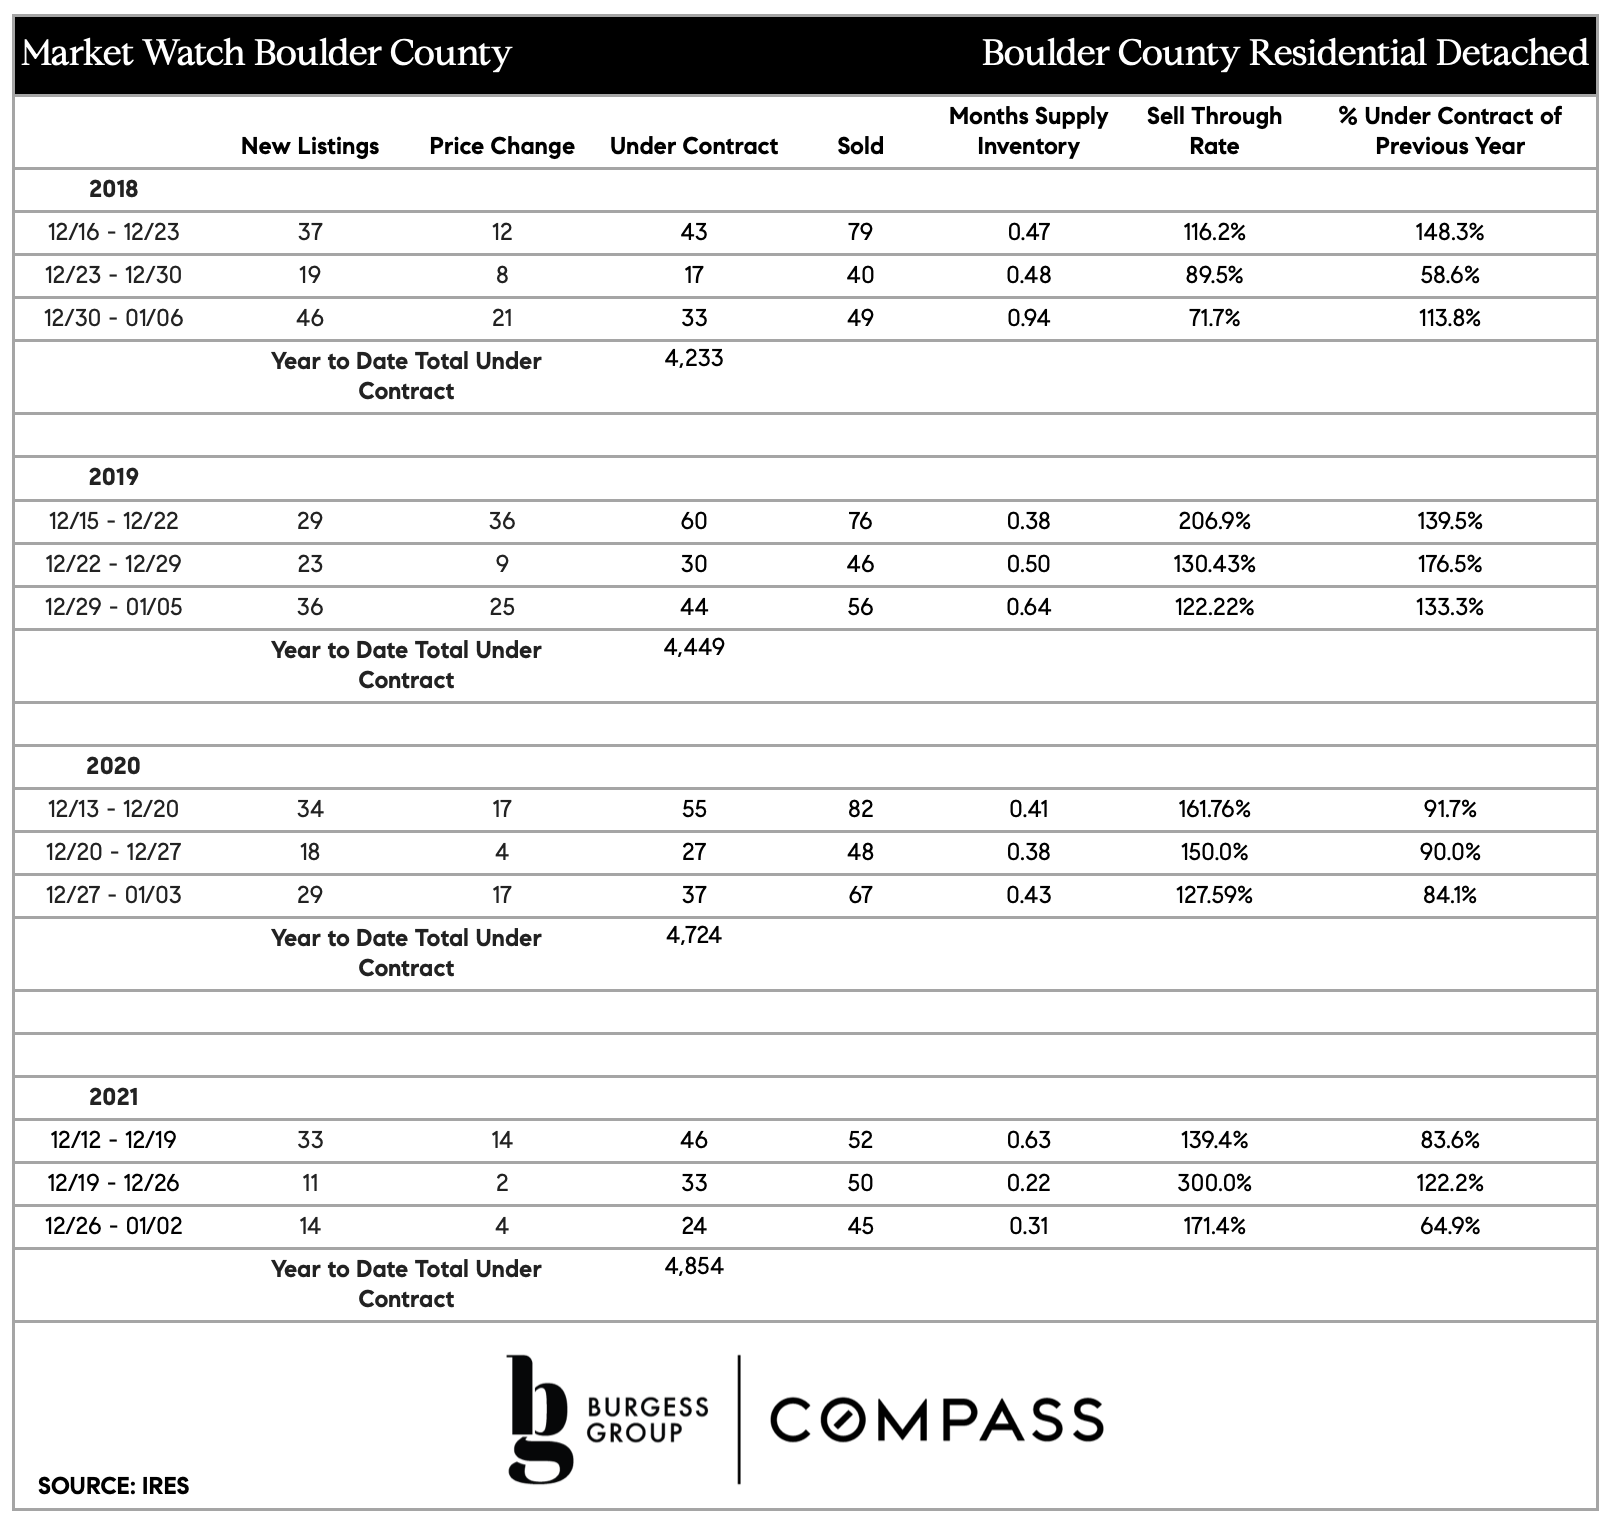
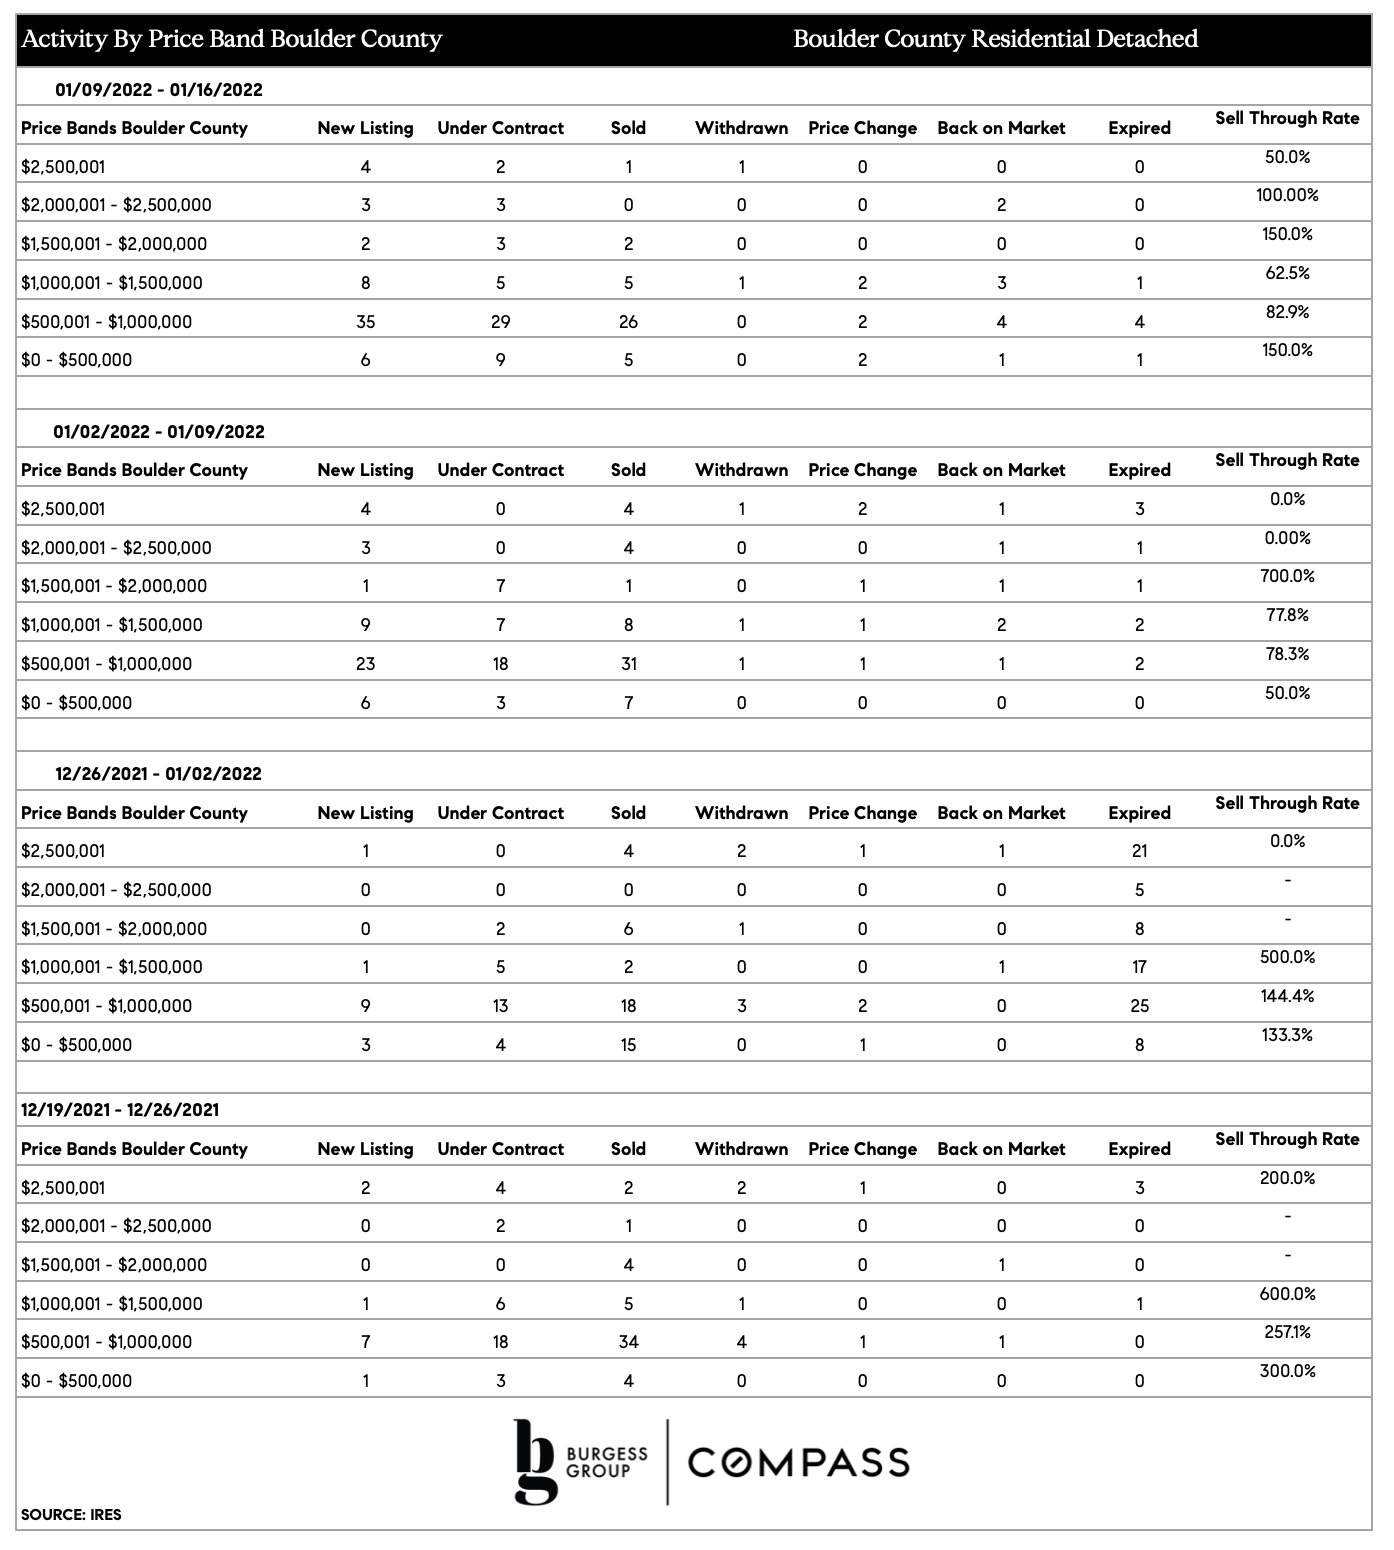
Boulder County realtors report on 67 new listings coming to market last week, vs 70 in 2018, 75 in 2019, 129 in 2020, 89 in 2021, and 72 in 2022. We may see inventory rise, as the Fed maintains its push to reduce inflation; we will also likely have some sellers sitting on the sidelines waiting for a hotter market. Check the "Activity By Priceband" section to see how much inventory increase we've had in the last 3 months per price band.
52 properties went under contract last week, compared with 93 in 2018, 79 in 2019, 107 in 2020, 101 in 2021, and 66 in 2022. Low under-contracts this year, which puts buyers in a stronger position in this market. Check the "Activity By Priceband" section below to see where buyers are in the driver's seat.
The year-to-date under-contract data reveals the changing dynamics in this year's market. As of now, there have been 2916 year-to-date (YTD) under-contracts (UC). Comparing this to previous years, in 2018, the YTD UC count was 3559; 2019 was 3691; 2020 was 3862; 2021 hit 4179; and in 2022, the YTD sales were at 3227.
Like our last newsletter's findings, under-contracts are 30% below the peak market activity observed in 2021 and 10% lower than the market's lowest point in 2022. When our Compass Boulder real estate agents here at Burgess Group average the two non-pandemic years we’re tracking, we get 3625 UC yearly; today’s under-contract rate is 20% below this 2018/2019 average.
Please remember that 2020, 2021, and 2022 were outlier years.
|
Activity By Price Band and Price Reductions- Boulder County
To get more granular on inventory, this week, our Boulder realtor team here is reviewing the amount of inventory in each price band we cover in the City of Boulder.
'Months' Supply of Inventory' (MSI) refers to the number of months it would take for the current inventory of homes on the market to sell, given the current sales pace.
Remember that a balanced market is 5-6 months supply of inventory. Below 5 is a seller's market, above 6 is a buyer's market.
Last 6 Months of Activity: 2.5 months of inventory available
Last 3 Months of Activity: 2.8 months of inventory available
This is a strong seller's market.
Last 6 Months of Activity: 3 months of inventory available
Last 3 Months of Activity: 3.2 months of inventory available
This is still a solid seller's market.
Last 6 Months of Activity: 3.4 months of inventory available
Last 3 Months of Activity: 3.7 months of inventory available
This is a fairly strong seller's market.
Last 6 Months of Activity: 4.3 months of inventory available
Last 3 Months of Activity: 4.6 months of inventory available
This is close to a balanced market.
Last 6 Months of Activity: 4.5 months of inventory available
Last 3 Months of Activity: 3.6 months of inventory available
Again, quite a good seller's market in the past 3 months.
Last 6 Months of Activity: 13.4 months of inventory available
Last 3 Months of Activity: 22.4 months of inventory available
This is an extreme buyer's market.
To note, this market is not stagnant. In the last 6 months, on average 9.5 houses sold per month. In the last 3 months, 5.7 houses sold per month on average.
* If you’d like us to break down different segments of the luxury market ($2.5-5mm, $5-7.5mm, etc), please get in touch with the Burgess Group Boulder realtors directly. It is a phenomenal time to be a luxury buyer in Boulder; Boulder luxury sellers have to bring their A games to get their properties sold.
OF HUGE IMPORTANCE: Even though we still have seller's markets, the market is not functioning the same way that it was at its pandemic peak. Sellers need to adjust their expectations of buyer behavior. Please call and speak to a Boulder realtor at Burgess Group for details on how to be a successful buyer or seller in your segment of today’s market.
Next time, we'll review MSI in Boulder County.
PRICE REDUCTIONS
In the past month, we've noticed weekly price changes of 94, 107, 89, and 87, consistent with the typical seasonal pattern. Many sellers opt to lower their asking price before Thanksgiving or Christmas to motivate buyers to purchase.
|
Q4 Real Estate Forecast from Altos Research
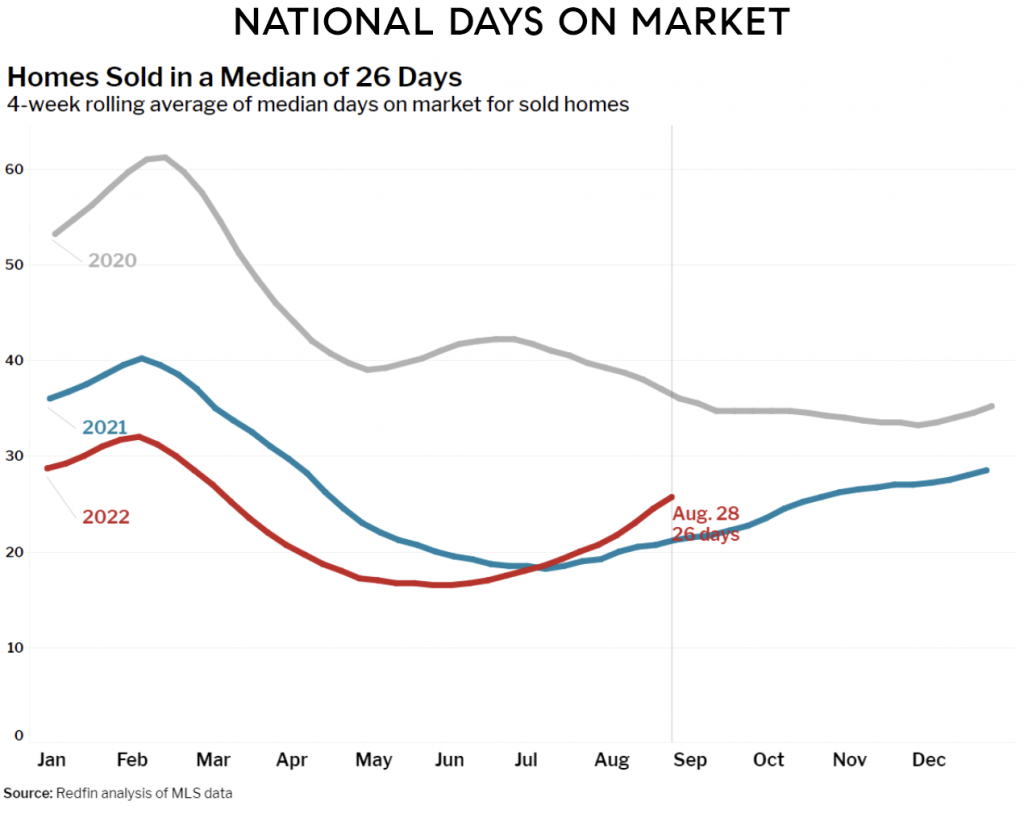
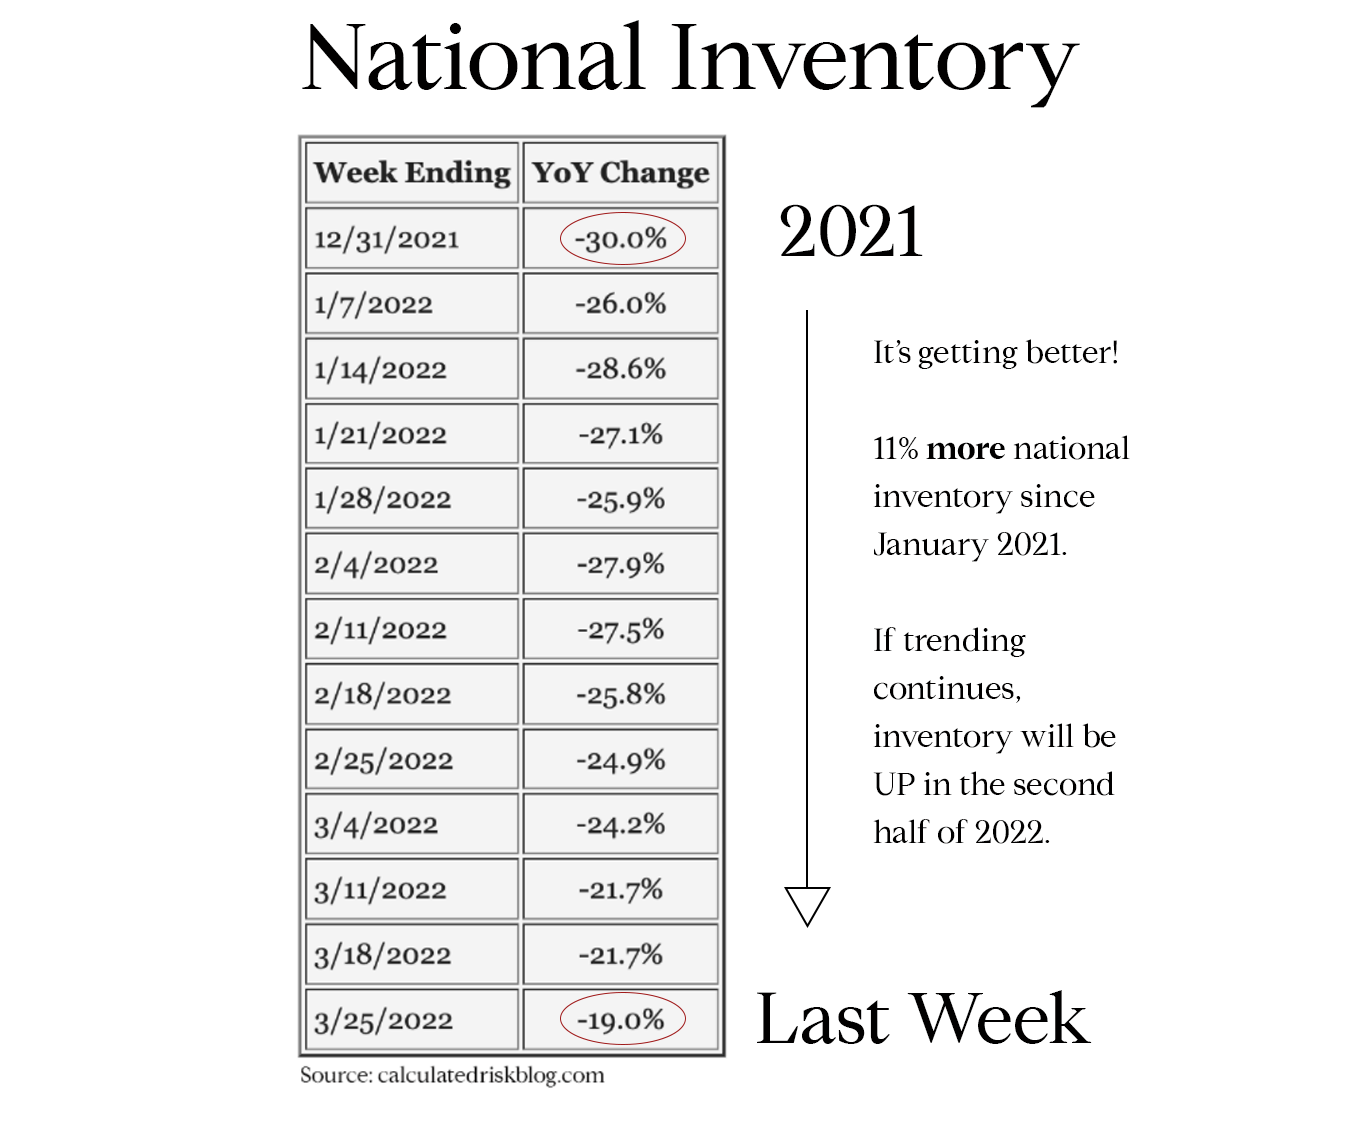
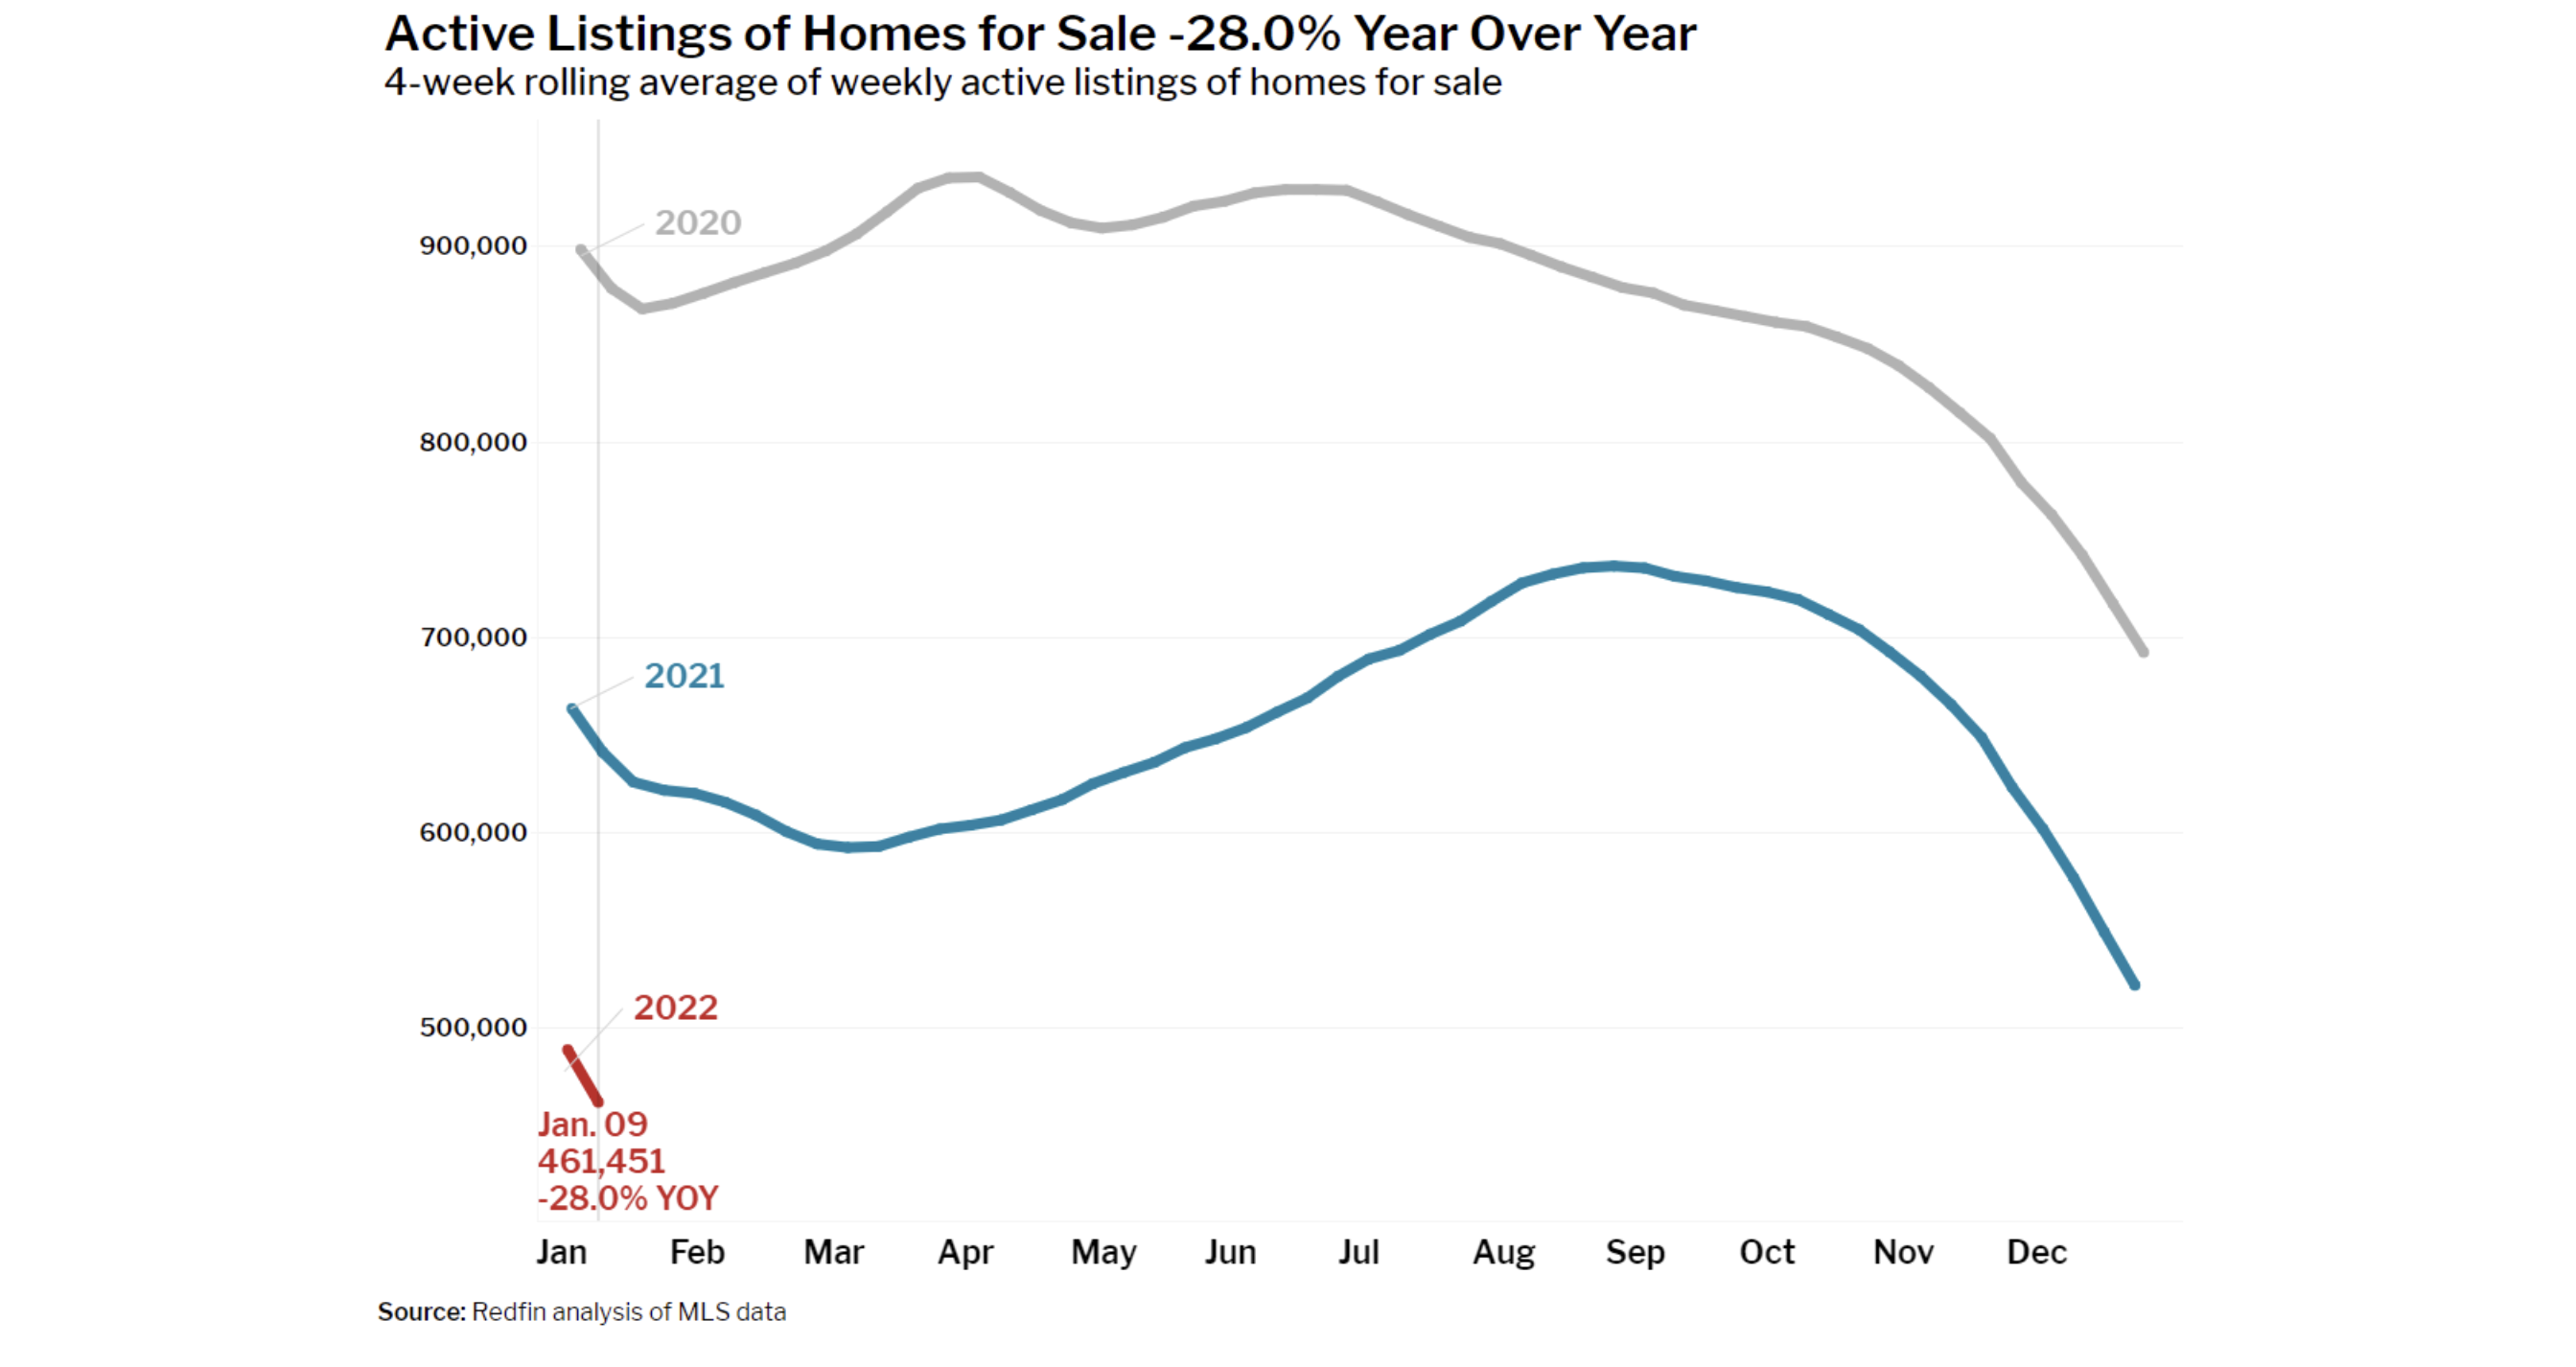
Nationally, inventory is increasing, though still below the historical norms of 2017, 2018, and 2019, but higher than 2021 and lower than 2022 year-to-date due to rising interest rates.
The median U.S. asking rent remained largely stable for the sixth consecutive month compared to a year ago, with a 0.4% year-over-year increase in September. Previously, rent growth had been slowing for about a year after a surge in prices during the pandemic. While apartment construction is slowing, rents in the Midwest and Northeast are rising, while rents in the West are falling. In September, the median asking rent also declined by 2% compared to the previous month.
According to Chen Zhao, Redfin's Economics Research Lead, rents have stabilized due to an influx of new apartments on the market, yet they haven't significantly dropped because demand remains steady. High mortgage rates are keeping potential homebuyers and sellers on the sidelines. While ongoing construction will add more supply, it's expected to slow, which could ultimately support rent prices.
In the Midwest, the median asking rent reached a record high of $1,436, marking a 5% year-over-year increase. Similarly, in the Northeast, the median asking rent rose by 3.1% to $2,482. However, in the West, asking rents decreased by 1.6% to $2,413, and in the South, they saw a slight decline of 0.3% to $1,653.
|
Below you'll find the types of homes our buyers are currently seeking. Do you know someone who is on the fence about selling their home? Perhaps you've been considering it?
Please let the Compass Boulder realtors at Burgess Group know if you or anyone you know has a home that might fit. We'd love to help!
|
marketingcenter-colorado-boulder
|


