Friends,
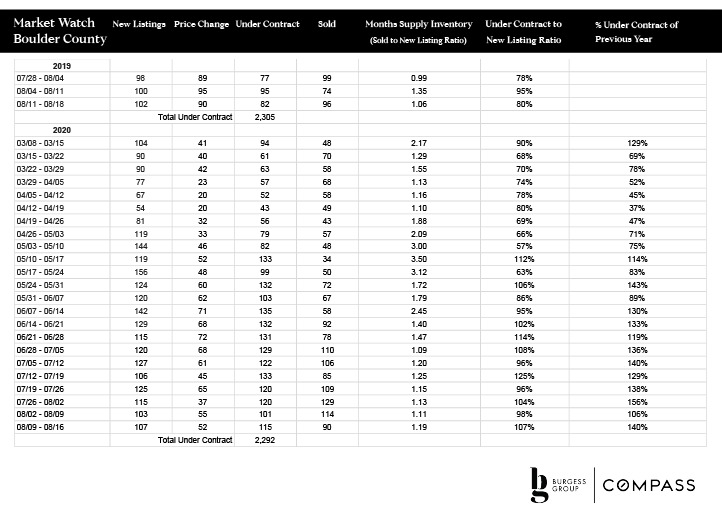
Last week our numbers were slightly more robust than a typical mid-August week.
Before we review last week’s numbers, here is your weekly diverson: an adorable palm-sized elephant relative was just sited for the first time in 50 years in Djibouti.
BOULDER COUNTY REAL ESTATE MICRO DATA:
Boulder County Stats 8/02-8/09/2020
THE AGGREGATE MARKET:
Numbers were up a bit again last week. New listings and under-contracts were slightly up both week-over-week and year-over-year. Both are signs of future market health/current market health as they are leading (listings) and conincident (under-contracts) indicators.
Price changes remain significantly lower than 2019 numbers, indicating that many sellers are not yet adjusting property pricing to reflect market value. These sellers are pricing more like they’re in a spring market than a late summer market.
If sellers are waiting for strong appreciation to raise market value up to their pricing, they may wait a while. Unlike some other parts of the country (Pheonix, Vegas) which are seeing huge inventory shortages and price increases, we are not seeing that here. Our inventory and undercontracts are overall quite balanced.

THE MARKET BY PRICE BAND:
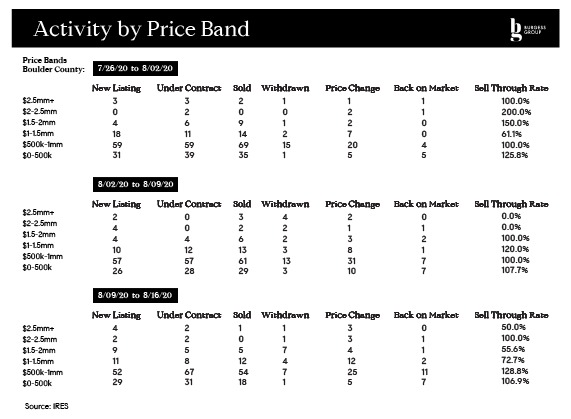
For the past three weeks, the $1mm and below market has been stable, with similar numbers of new listings and under-contracts.
If we look at the higher price points over the past three weeks, we will see that higher-end buyers are listing and purchasing in fits and starts, but there is still good activity happening in these ranges.
Together this behavior indicates both buyer and seller confidence in the lower and upper markets.

Local Real Estate In A Nutshell
We’re a broken record about inventory: housing stock is tight. If you’re thinking of selling, getting to market for our secondary (fall) selling season would be smart.
We are only 13 under-contracts away from being at the same number of under-contracts as in 2019 Y-o-Y, which is pretty astounding given the quiet March, April, and May. We’re continuting to see urban flight to the area increasing demand.
Usually, Northern CO has a spring primary selling season, a quiet July and August, then a secondary fall selling season which normally starts around 10 days after Labor Day and lasts 4-12 weeks depending on the year.
Stay tuned to see if we have greater- than-usual activity through the Labor Day weekend, since fewer people are out of town. Also, let’s keep our eye’s peeled for the typical fall boose of activity.
Call us with questions.
NATIONAL MACRO DATA:
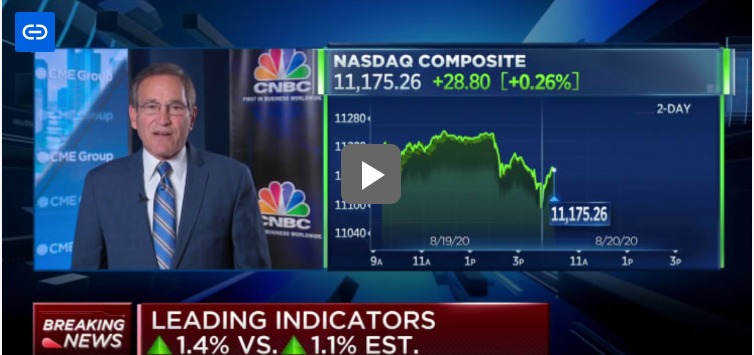
July leading economic indicators are up 1.4% versus 1.1% expected, with positive numbers for the second month in a row.
Mortgage Rates Still Battling Hangover From Last Week’s Drama
Phoenix Real Estate in July: Sales up 12% YoY, Active Inventory Down 42% YoY
AIA: “July architectural billings remained stalled”
Evictions are expected to skyrocket as pandemic protections come to an end
Hotels: Occupancy Rate Declined 30% Year-over-year
Wishing you health. Call us with questions.
 CATHERINE BURGESS
Associate Real Estate Broker
303.506.5669
[email protected]
Associate Real Estate Broker
303.301.4718
[email protected]
© Compass 2020 ¦ All Rights Reserved by Compass ¦ Made in NYC
Compass is a licensed real estate broker and abides by Equal Housing Opportunity laws. All material presented herein is intended for informational purposes only. Information is compiled from sources deemed reliable but is subject to errors, omissions, changes in price, condition, sale, or withdrawal without notice. No statement is made as to accuracy of any description. All measurements and square footages are approximate. This is not intended to solicit property already listed. Nothing herein shall be construed as legal, accounting or other professional advice outside the realm of real estate brokerage.


