

Friends,
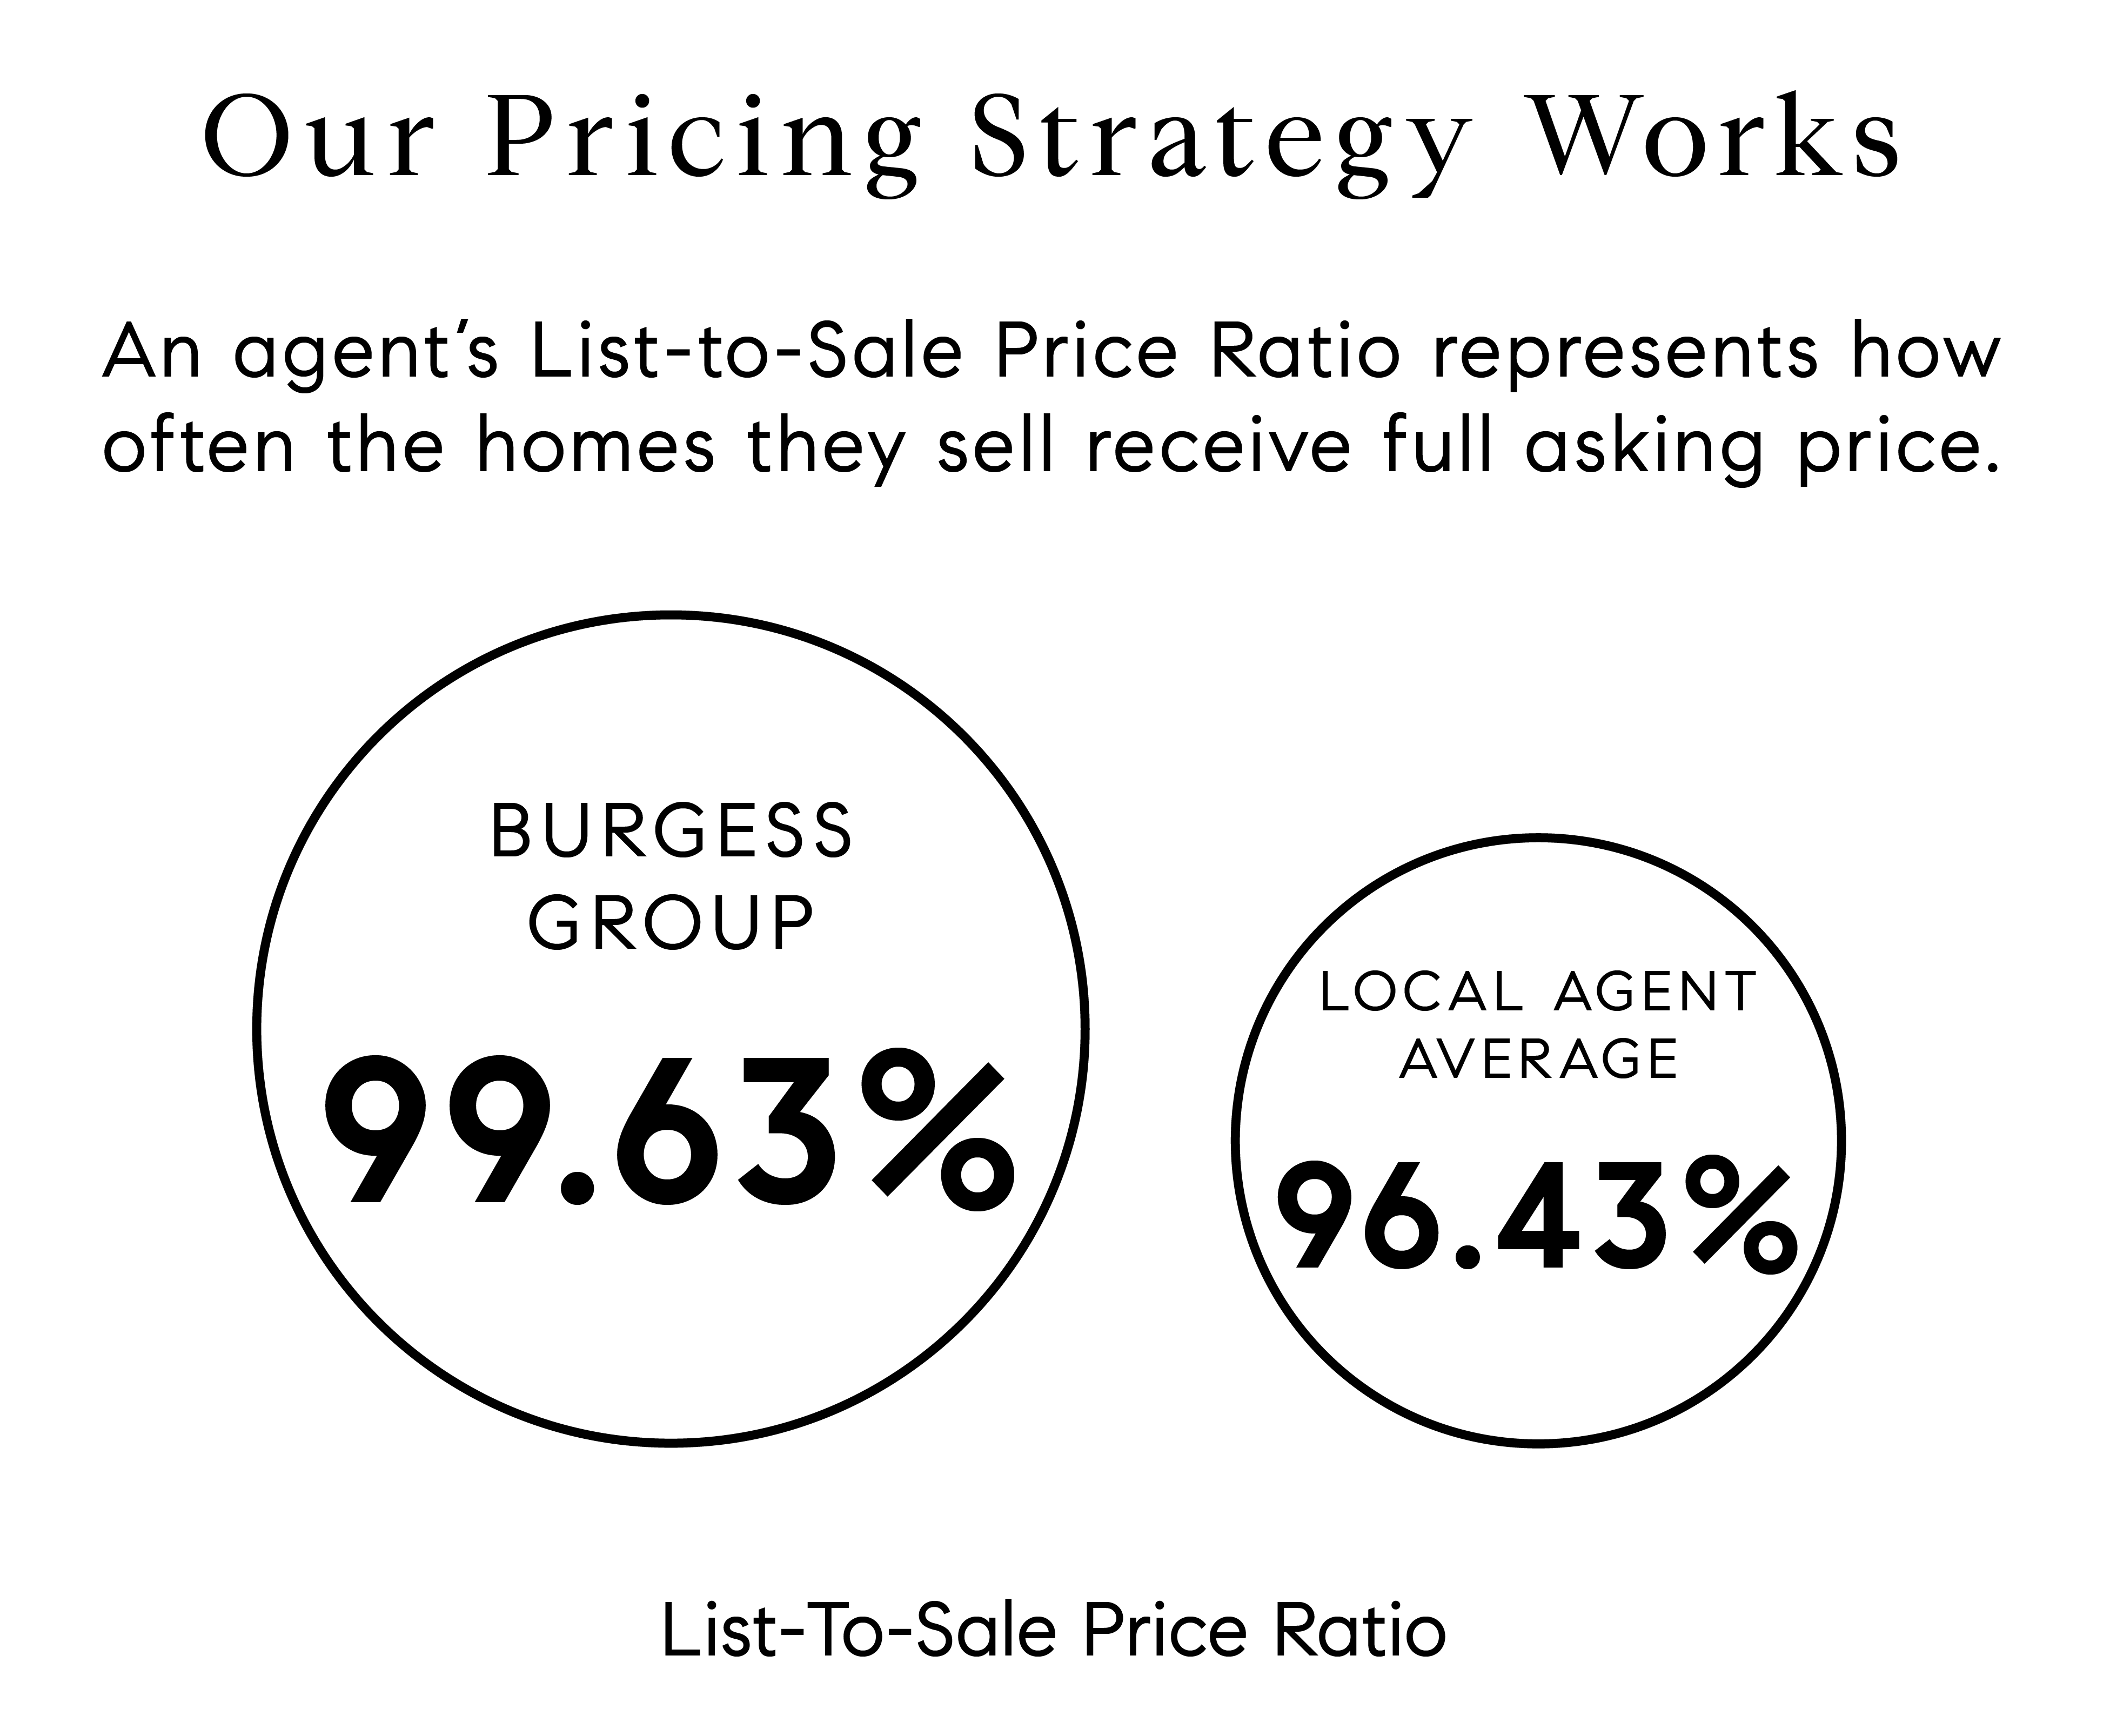
Our market is continuing at a fast pace, looking healthy in all price bands. The speed of our market is reflected by the national list-to-sale price ratio, and also through more specific local list-to-price ratios.

Aggregate Boulder County Market
2/7 – 2/14, 2021
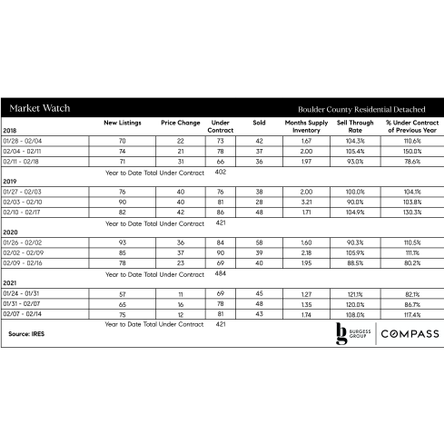
Last week we saw a small uptick in inventory. When you look at the numbers from last week and the number from 2019 for the same week, they are almost the same:
Inventory 2021 1.74 months; 2019 = 1.71 months
New listings 2021 = 78; 2019 = 82
Under-contracts 2021 = 81; 2019 = 86
Y-t-d Under-contracts 2021 = 421; 2019 = 421
That said, the big difference is that there are more buyers circulating in the marketplace, so the purchase process is more competitive.
<- Data nerds, click up there
How Is The Local Market
By Price Band?
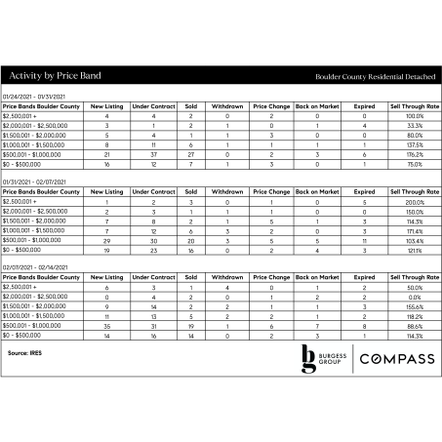
For the past three weeks, we’ve seen the most inventory come to market in the $500,001 – $1,000,000 range. Last week there was an 88.6% sell-through rate in that category, so it may be a little easier for buyers this week.
All categories continue to show robust health.
<- Data nerds, click here
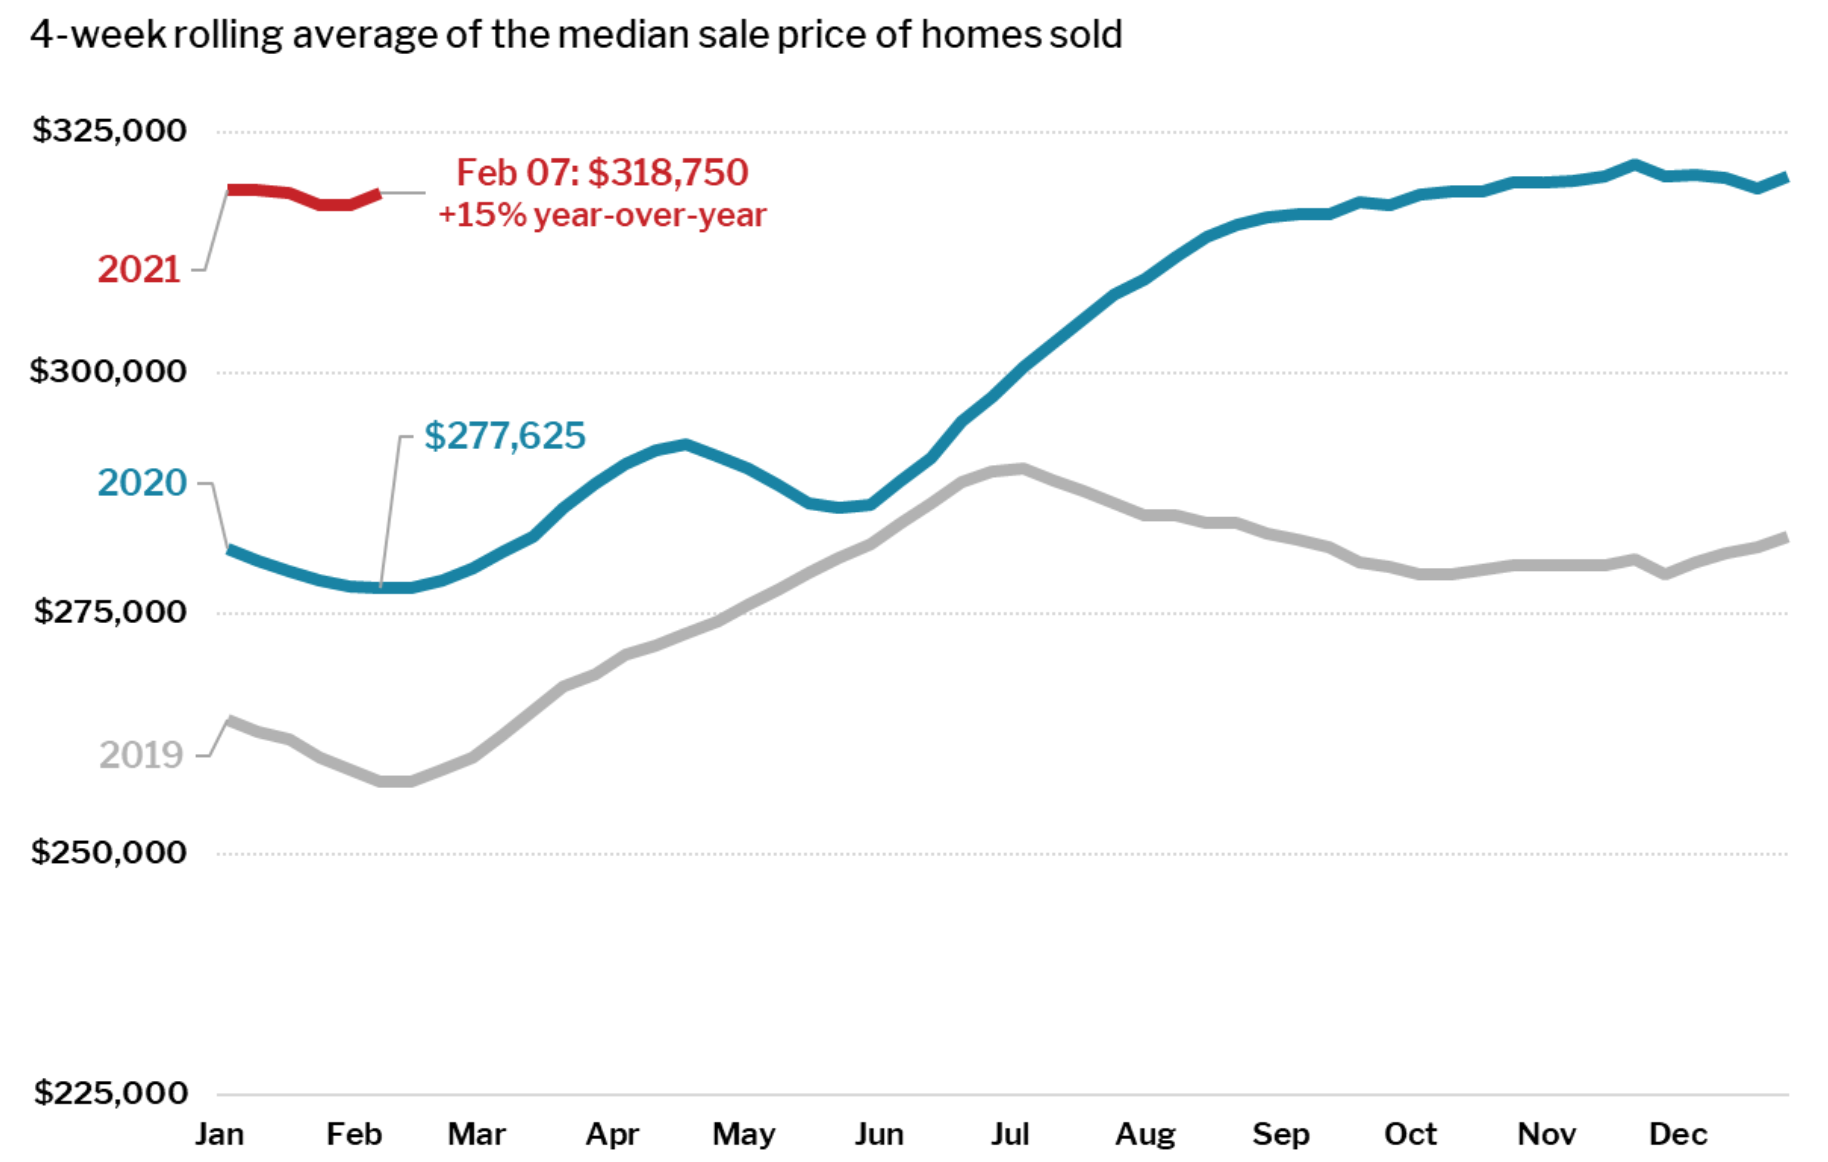
National Real Estate Data
National List-to-Sale Price Ratio At 99.3%
What is a list-to-sale price ratio?
The list-to-sale price ratio is the final sale price (what a buyer paid for the home) divided by the last list price. The resulting number is expressed as a percentage. If it’s above 100%, the home sold for more than the list price.
Our national list-to-sale price ratio is currently 99.3%. This means that if a home were listed for $100,000, on average it would be selling for 0.7% less than the asking price, or $99,300.
When there are lots of homes for sale and few buyers, sellers compete to attract buyers. In buyer’s markets like this, buyers are often able to negotiate prices down substantially, and the resulting list-to-sale price ratio falls hovers much farther away from 100%.
Right now, the national list-to-sale price ratio indicates a very tight seller’s market around the country. For comparison, in February 2019 it was slightly below 97.5% and in Feb 2020 it was 97.7%.
Although those percentage differences sound insignificant, applied to a $1mm, $2mm, or $3+ mm purchase, they can make a significant difference.
Different price ranges have different list-to-sale price ratios. We pulled the numbers in the $2.9mm+ market this week. For $2.9mm+ sales since May 2020 for the City of Boulder, the average list-to-sale price ratio is 100.11%, with the low being 89.1% and the high being 113.5%. When you break the data down further, it is possible to see that there are still a lot of people who purchase below asking, but sales at asking and above asking in this price point have definitely increased from how the market functioned 12-24 months ago.
Burgess Group Compass Exclusive Listings
Click anywhere below to check out our current exclusive listings.

Contact us for private off-market opportunities
Burgess Group Blog

Boulder County COVID Testing &
Blood / Plasma Donation

Donate COVID-19 Plasma & Blood:
Boulder County is in great need of plasma and blood; if you’ve already had COVID-19, your donation is even more valuable; join our team members Kevin (pictured here) and Andy in giving regularly.
Learn more here to help our community.
Testing:
The Stazio Ballfields off 63rd and Stazio reopened for drive-up COVID-19/other tests. It can be very efficient, quick, and easy to pre-register online.
More Real Estate News
Cheap old homes draw U.S. millennials escaping pandemic cages
Mortgage Delinquencies Decrease in the Fourth Quarter of 2020
Treasury yields rise slightly following jobless claims data
The Fun Stuff: Zillow – SNL

Compass Founding Team

Catherine Burgess
Realtor
M: 303.506.5669
[email protected]

Andy Burgess
Realtor
M: 303.301.4718
[email protected]

© Compass 2021 ¦ All Rights Reserved by Compass ¦ Made in NYC
Compass is a licensed real estate broker and abides by Equal Housing Opportunity laws. All material presented herein is intended for informational purposes only. Information is compiled from sources deemed reliable but is subject to errors, omissions, changes in price, condition, sale, or withdrawal without notice. No statement is made as to accuracy of any description. All measurements and square footages are approximate. This is not intended to solicit property already listed. Nothing herein shall be construed as legal, accounting or other professional advice outside the realm of real estate brokerage.
