

Friends,
Last week we had a slightly slower market, moving at the same pace we saw in 2019 and 2018.
We’re trying something new this week. We made a video to explain all the data that Catherine and our team collects and analyzes each and every week.
This week Catherine chats about our local market’s weekly numbers and also how Boulder and Denver stack up against other big cities in the recently released Case-Shiller Home Price Index Report. Watch below!
(Don’t worry, our fun video offering just lives at the bottom of this email now!)
WEEKLY MARKET UPDATE VIDEO:
BOULDER COUNTY MICRO REAL ESTATE DATA:
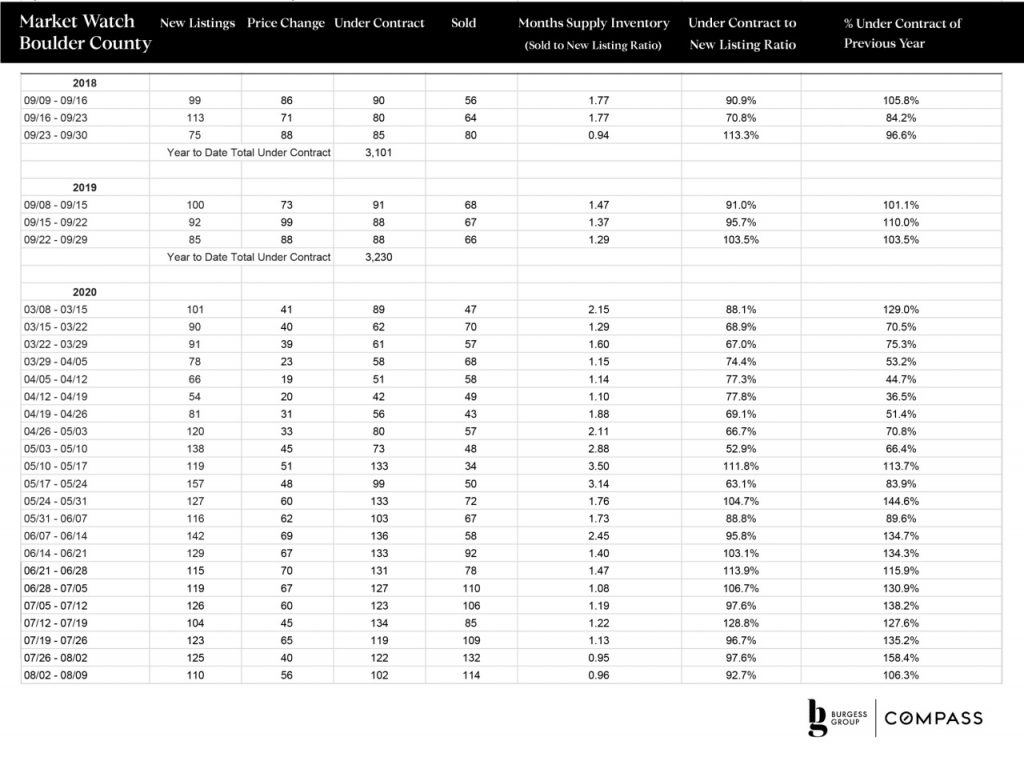
Boulder County Stats 9/20/2020-9/27/2020
THE AGGREGATE MARKET:
Ha! I love this stuff. And our data wizard Kevin does a terrific job providing us with reliable numbers.
Last week the market behaved similarly to the Year-over-Year (YoY) 2019 and 2018 numbers, except in price changes.
New listings: 88 in 2020, 85 in 2019, 75 in 2018
Under-contracts: 90 in 2020, 88 in 2019, 85 in 2018
Price Changes: 57 in 2020, 88 in 2019, 88 in 2018
Months Supply Inventory: 1.09 in 2020, 1.29 in 2019, .94 in 2018
Week over Week (WoW), both under-contracts and new listings were down by 15.
Click the chart below to enlarge
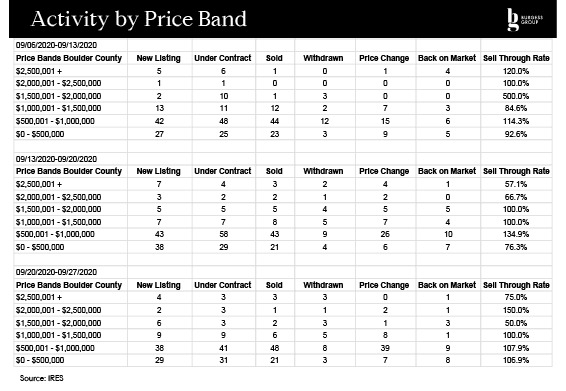
THE MARKET BY PRICE BAND:
Market behavior by price band was very consistent with the past couple of weeks, with the exception of price changes in the $500-1mm price range.
In the $2.5+mm market, there is now a bit more inventory.
Generally, there is healthy activity in all price bands, especially when you look at the overall numbers over the last three weeks.
Click the chart below to enlarge
LOCAL REAL ESTATE IN A NUTSHELL:
Our mercurial 2020 market resulted in higher year-to-date under-contracts (3,320), even with 3 months of lower activity. 2019 had 3,230 and 2018 had 3,101 under-contracts YTD.
The market may now have decelerated to a typical fall pace. Let’s keep watching to see if demand holds.
Why are our local prices remaining fairly steady or having slight increases when other parts of the country are seeing big increases or decreases?
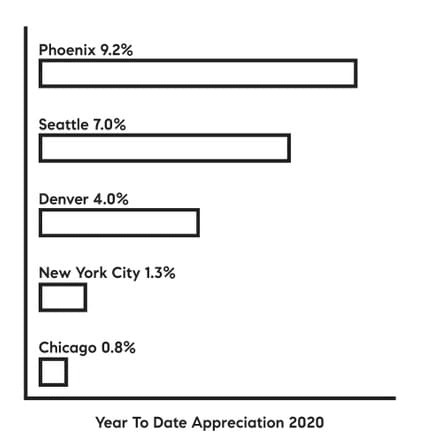
The Case-Shiller Index reported annual gains recently.
Phoenix (9.2%), Seattle (7%) and Tampa (5.9%) reported the highest year-to-date annual gains, with New York (1.3%), Chicago (.8%), and San Francisco (2.5%) having the smallest.
According to the Case-Shiller 20-City Composite Index, Denver’s cumulative gains for this year are 4%. (Boulder’s market is too small to be included.)
April/May saw .5% gain, and May/June also saw .5% gain. Denver’s slow incremental gain reflects a fairly balanced number of new listings to under contracts, with a slight skew towards under-contracts.
This is exactly what we’ve been reporting. Altogether, the sell-through rate has resulted in small, steady price gains throughout the area. Our annual appreciation will probably end the year a point or two higher than we saw in 2019 (3.7%).
This is super consistent with the Federal Housing and Finance Agency appreciation data history for northern CO since 1979. We see minimal depreciation, and we mostly see slow/steady growth. Let us know if you’d like to see more info about how northern CO stacks up against other parts of the country
MARKETING MOMENT:
ELEVATE THE VALUE OF YOUR HOME
The goal of staging is to make the home speak to buyers in a compelling, positive way. We will advise you on how to stage your home for maximum return on investment and easiest sale.
Need help staging your home? Give us a shout!

NATIONAL MACRO DATA:
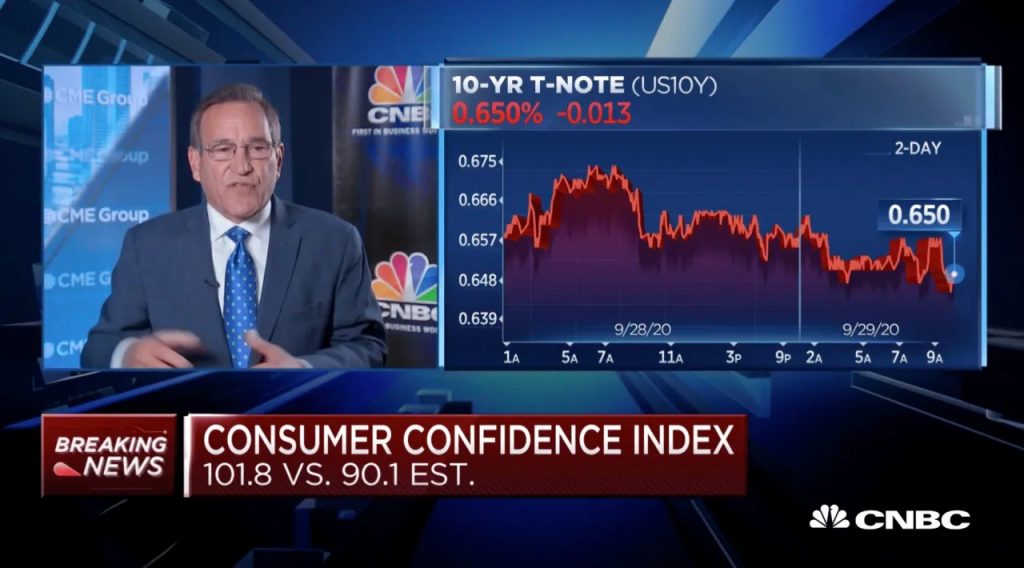
Consumer Confidence Index at 101.8, best number since March 2020
NY Fed’s Williams sees about three years for full U.S. recovery
Share of Mortgage Loans in Forbearance Declines to 6.87%
S&P CoreLogic Case-Shiller Index Reports 4.3% Annual Home Price Gain
BURGESS GROUP BLOG:

THE FUN STUFF:
 CATHERINE BURGESS
Associate Real Estate Broker
303.506.5669
[email protected]

Associate Real Estate Broker
303.301.4718
[email protected]

© Compass 2020 ¦ All Rights Reserved by Compass ¦ Made in NYC
Compass is a licensed real estate broker and abides by Equal Housing Opportunity laws. All material presented herein is intended for informational purposes only. Information is compiled from sources deemed reliable but is subject to errors, omissions, changes in price, condition, sale, or withdrawal without notice. No statement is made as to accuracy of any description. All measurements and square footages are approximate. This is not intended to solicit property already listed. Nothing herein shall be construed as legal, accounting or other professional advice outside the realm of real estate brokerage.
